
Australian property values continue to climb: CoreLogic August housing chart update
15 August 2023


Abdullah Popal
Managing Director
Amidst a barrage of twelve interest rate hikes that resulted in rates surging by more than 4% within the past year, property values continue to increase. The RBA’s decision to pause the last two interest rate increases has stirred up a wave of confidence among Australians, creating a buzz around an even hotter housing market.
This environment has caused sellers to eye the opportunity to fetch top dollar for their properties, while on the flip side, property buyers are stepping into the market with assurance, undeterred by the ongoing robust backdrop of strong inflation.
National dwelling values surge by 2.9% in three months leading to July – marking the strongest quarterly growth since January 2022
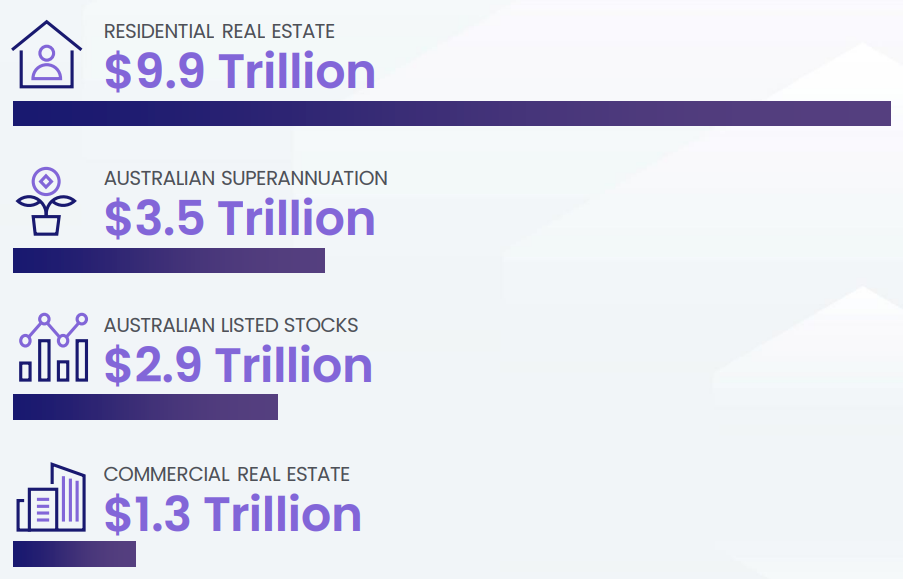
The total worth of all residential real estate in Australia (11 million dwellings) hit an impressive $9.9 trillion at the end of July, jumping up from $9.8 trillion in June. What’s even more interesting is that more than half, about 56.3%, of all the money Aussie households have, is tied up in these homes. It shows just how important these houses are to Australia’s overall wealth.
Continued growth in home values
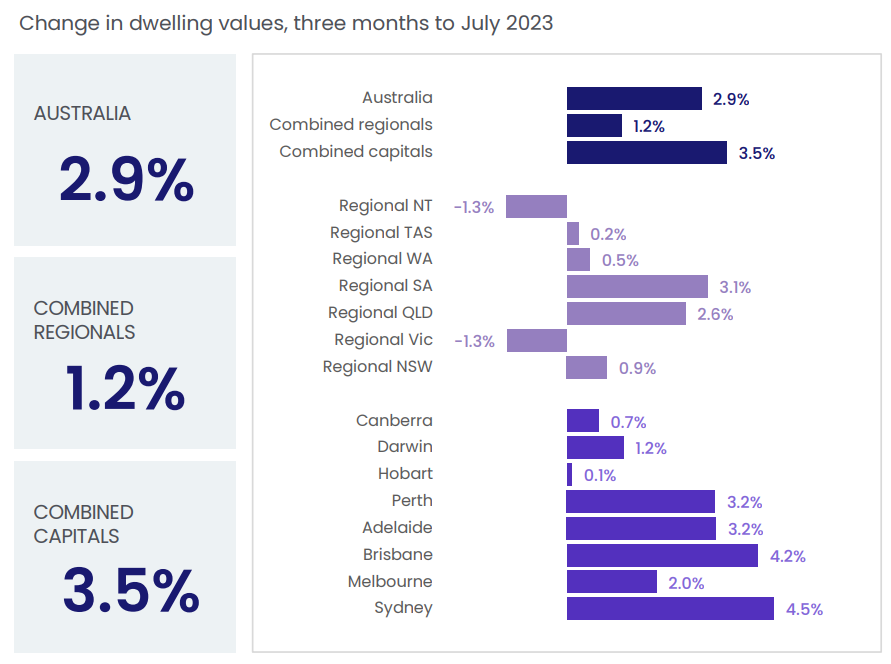
The value of homes is still on the rise. Over the past three months leading up to July, homes across the country became 2.9% more valuable. This growth is the highest we’ve seen in a single quarter since January. However, the speed of growth slowed to 0.7% from 1.1% in June. This positive trend is a result of low supply but high demand in capital cities.
City homes becoming more valuable
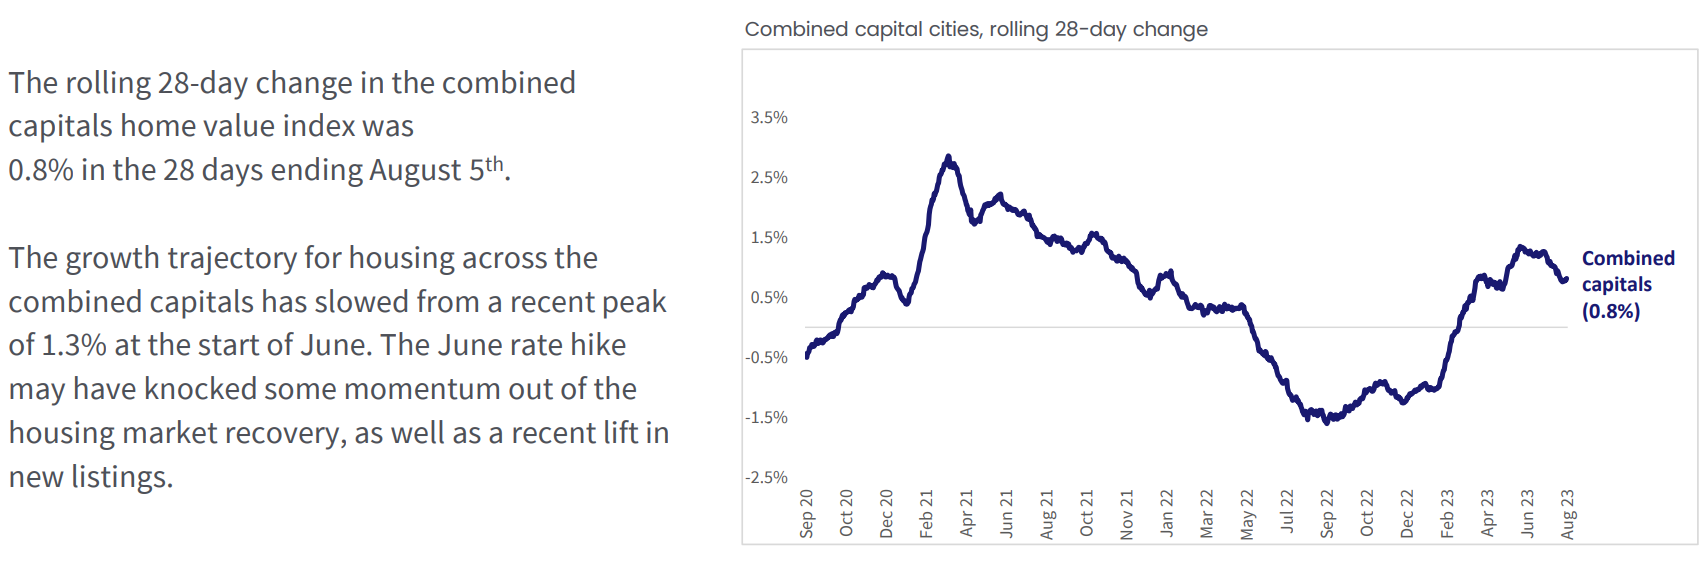
The combined value of homes in the big cities went up by 0.8% in July, easing from a 1.2% lift in June. Monthly increases across the combined capitals surpassed a 0.2% lift in the combined regional market over the month. This shows that the city housing market is still moving forward, just at a slightly slower pace than before.
Sales volumes are tracking towards the historic five-year average of 40k, but we’re still in a seller’s market
CoreLogic data shows there were 39,064 sales in July nationally, compared to a historic five-year average of 40,120 for the month of July. The trend suggests sales volumes are stabilising, despite being down from recent highs in 2021.
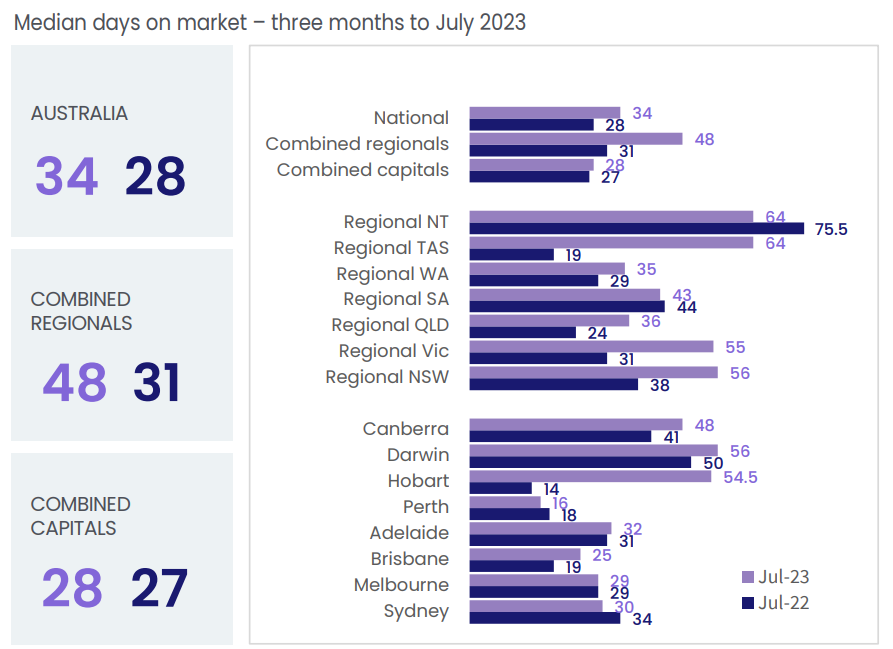
The amount of time it takes to sell property trended slightly higher through the three months to July, with the median days on market climbing higher to 34 days – up from a low of 30 days in the three months to April.
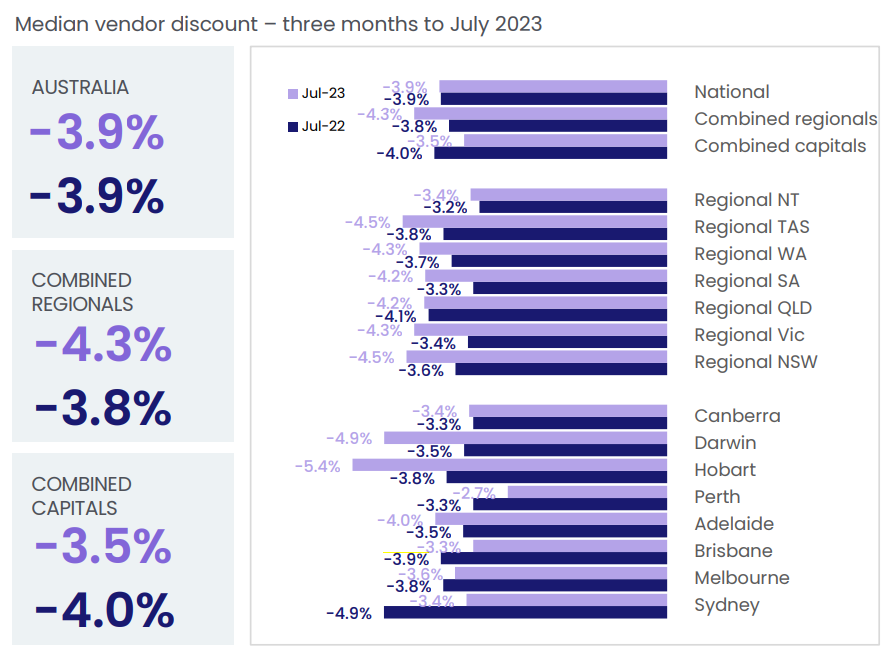
On average, sellers are exhibiting rigidity and giving smaller discounts on their properties. In the three months leading up to July, the typical discount sellers offered across the country was -3.9%. This is a bit higher compared to the -4.4% discount seen at the end of last year. It‘s like sellers are becoming a little less flexible with their prices.
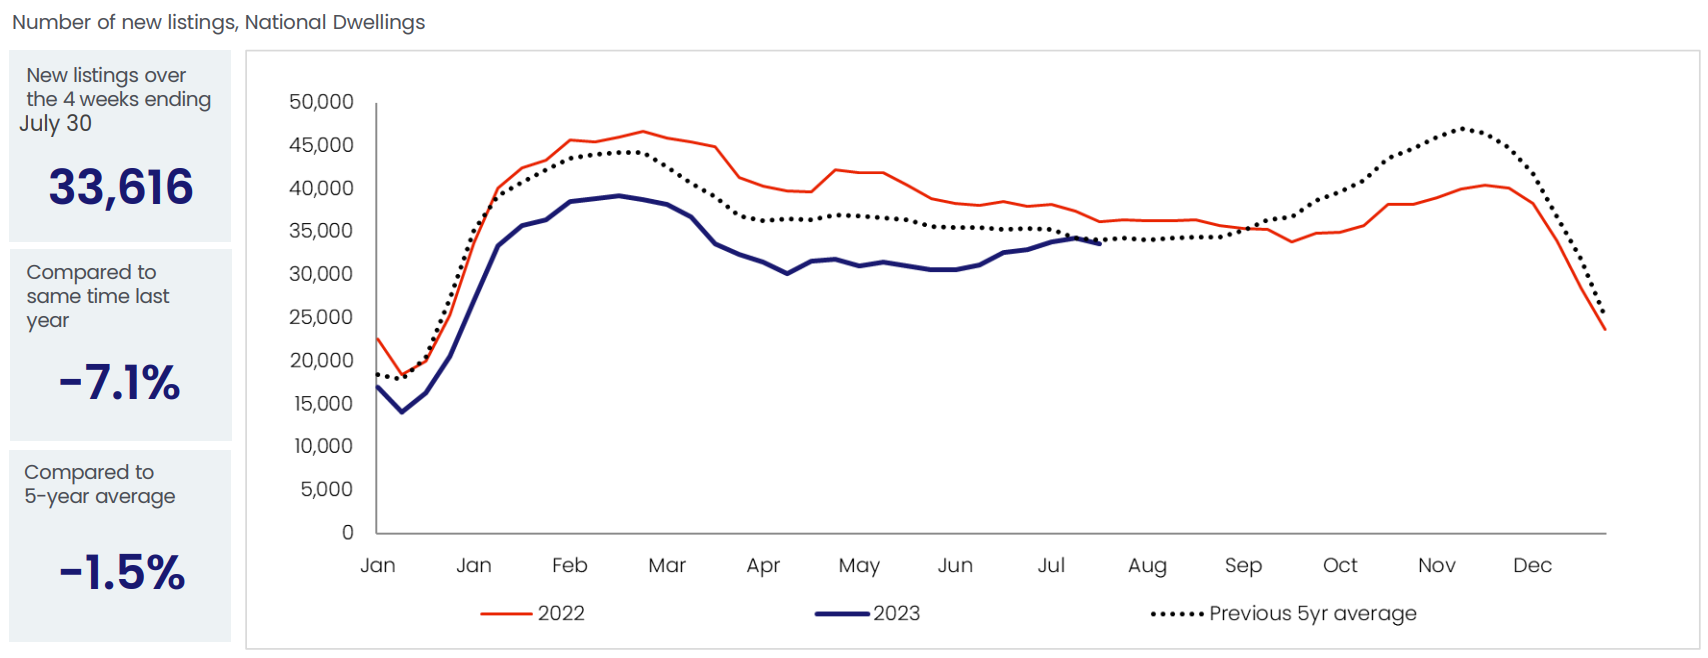
In the four weeks leading up to July 30, a total of 33,616 new listings popped up nationally which is unusual for this time of year. But looking at the five-year picture, these new listings are still a little lower than what we’ve seen as an average.
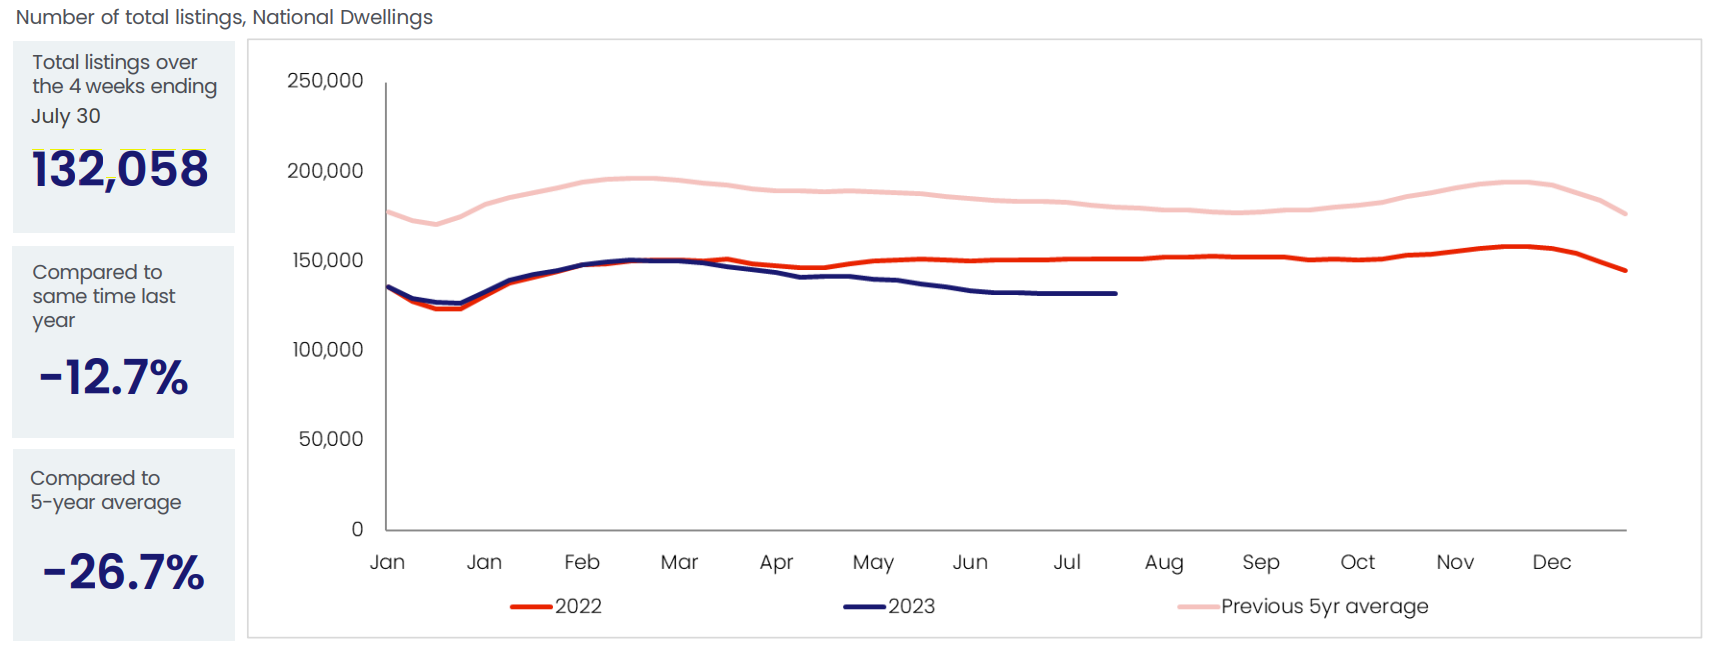
Nationally, a total of 132,058 listings during the four weeks leading up to July 30, 2023. Total listings are trending lower than the previous five-year average due to strong property sales.
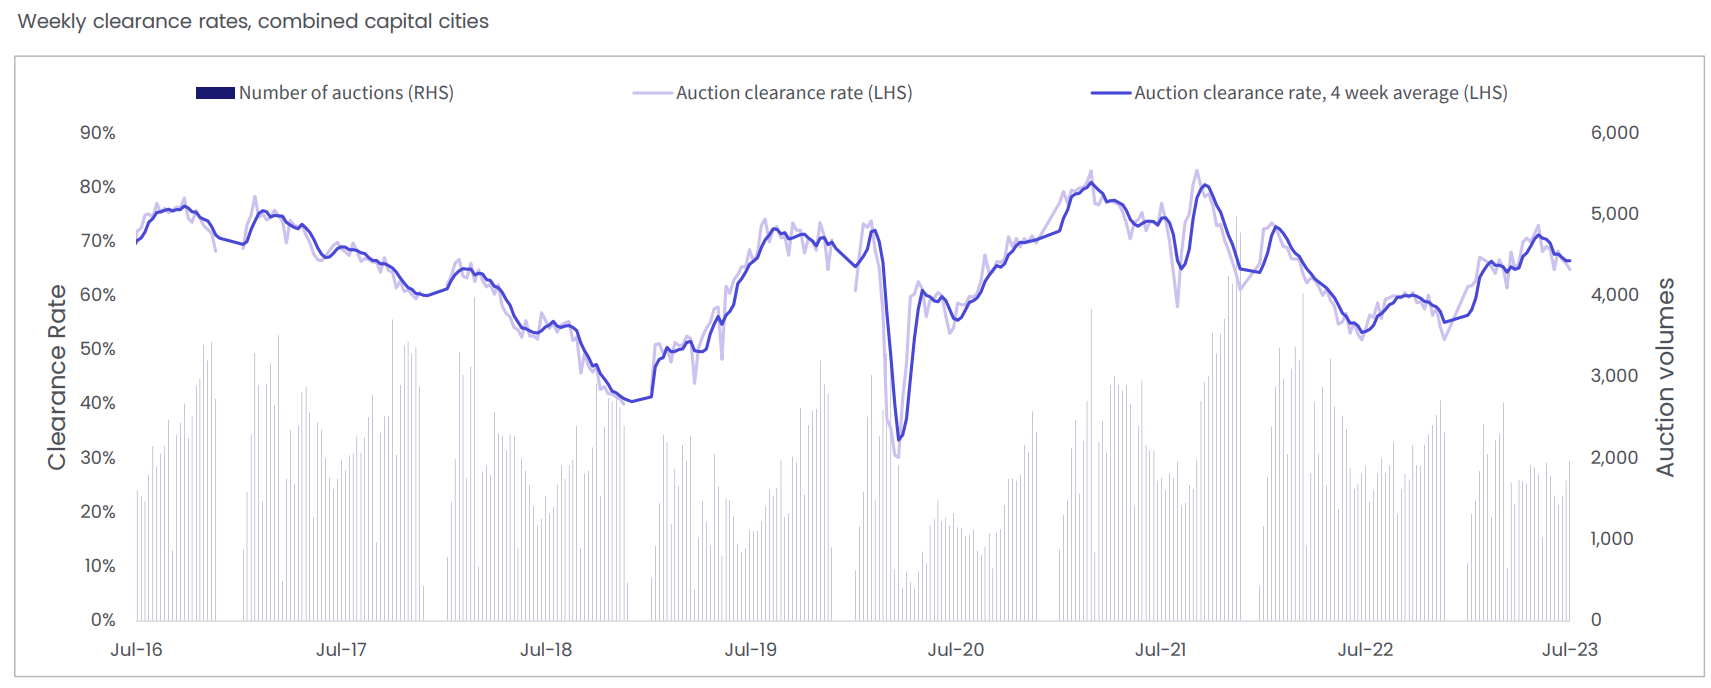
Auction clearance rates still trending above the decade average
The rate at which auctions are successfully completed in the capital cities is going strong. During the four weeks ending on July 30, 2023, the combined capital cities had an average success rate of 66.5%. Although this is lower compared to the recent high of 71.3% seen in the four weeks leading up to June 4, it’s important to note that the current rate is still higher than the average rate over the past ten years, which stands at 65.1%.
Australia’s rental situation presents opportunities for investors
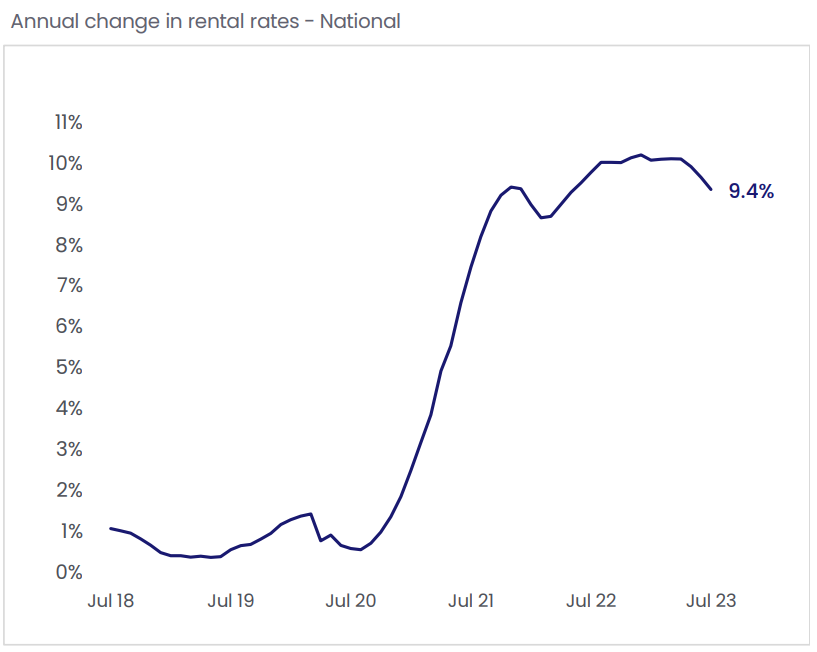
Australia is currently facing its most severe rental challenge ever, which might not sound great at first, but there’s a positive side for investors. Australian rent values increased a further 0.6% in July, taking the national annual increase to 9.4%. This is quite a bit higher than what we’ve seen in the past ten years, but the growth seems to be slowing down a bit now. To put it in perspective, the rapid rise we saw in rent last year, which was at a high of 10.2%, has started to slow down.
In July, the cost of rent in Australia went up by an additional 0.6%. That brings the total increase over the year to 9.4%. So, even though the yearly rental growth across the country eased a little to 9.4%, the situation is still quite positive, especially in the combined capital cities, where the growth remains relatively high at 11.3%. The places that are driving this growth in rent are Perth, Melbourne, and Sydney.
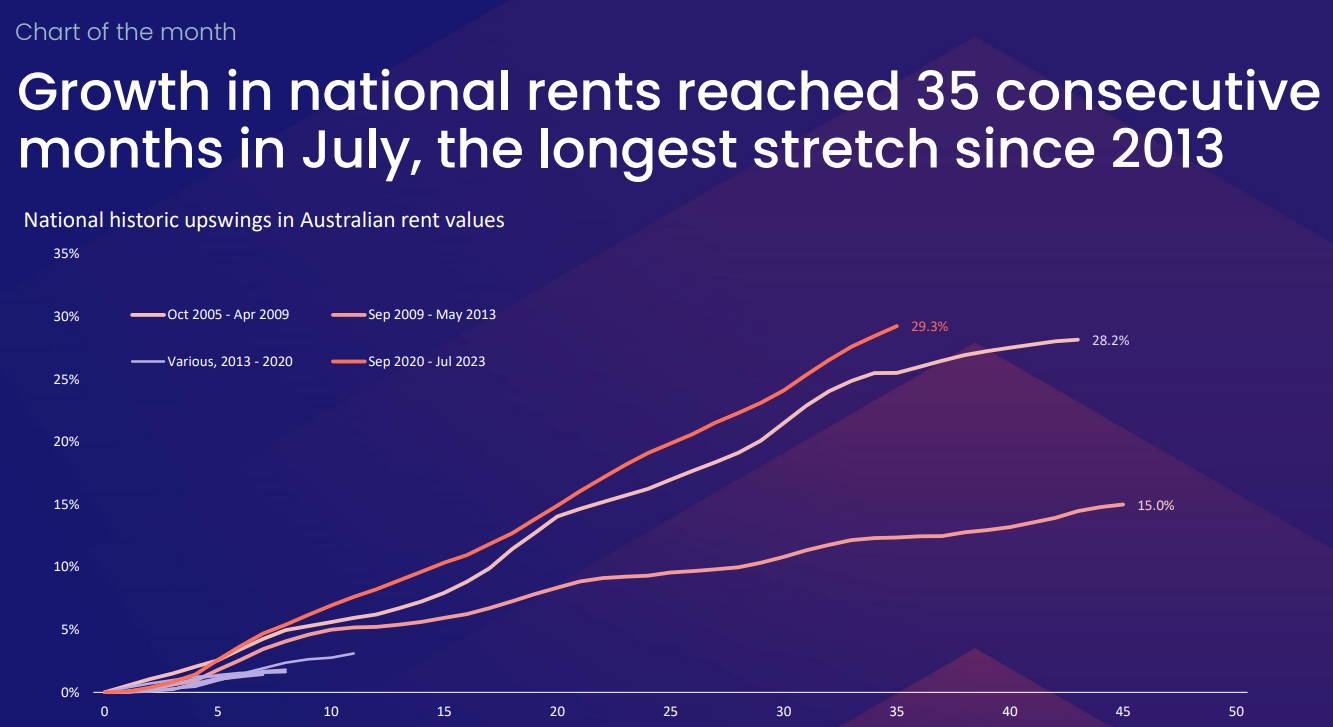
CoreLogic’s August ‘Chart of the Month’ compares historic periods of rental market upswings nationally, revealing that the current 35-month stretch of consecutive uplift is the longest growth period since 2009-2013 at over 29%.
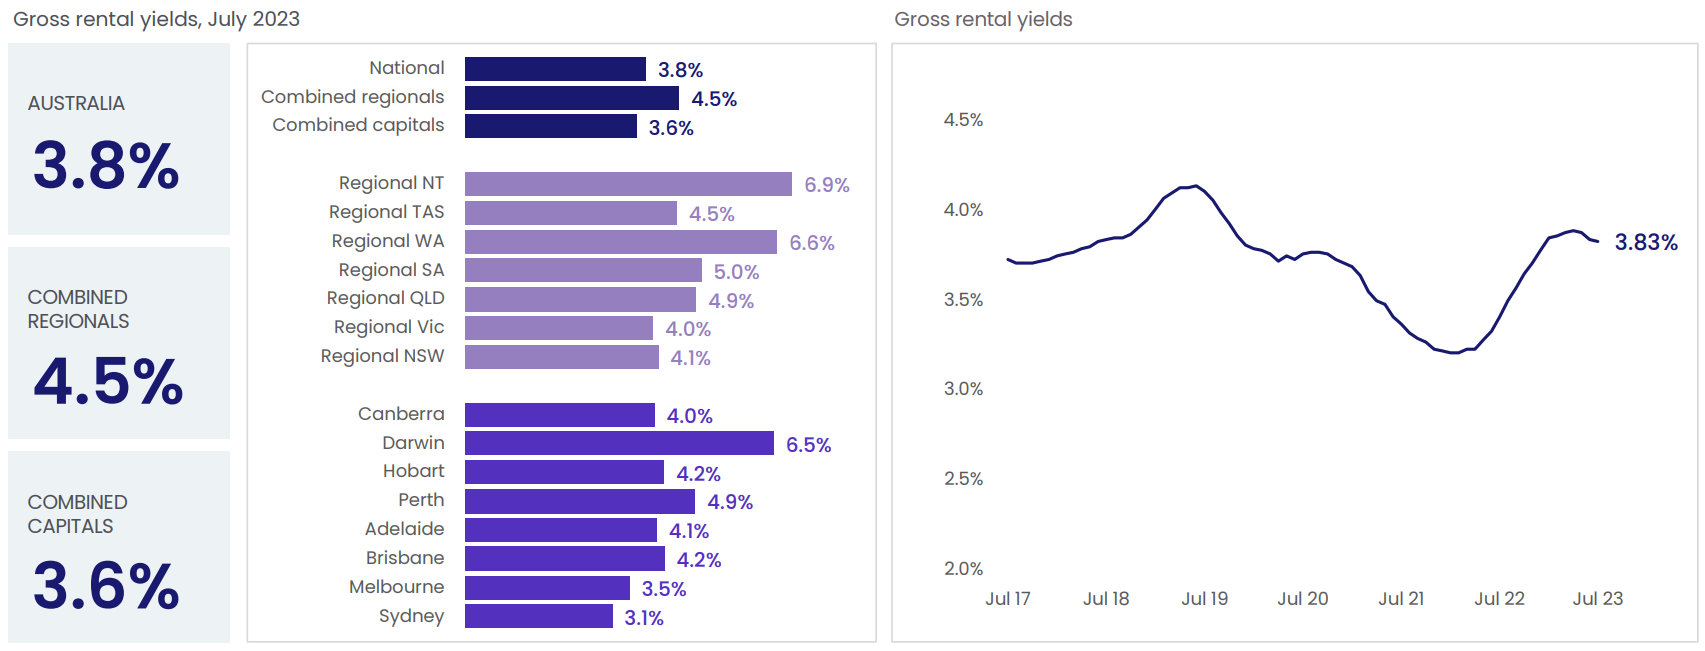
Looking at the monthly increase in rent values of 0.6% nationally, purchase values rose by 0.7%. This had a flow-on effect, reducing rental yield from 3.84% to 3.83%. Sydney and Melbourne lag behind the other capitals.
However, the rental market is very attractive to investors
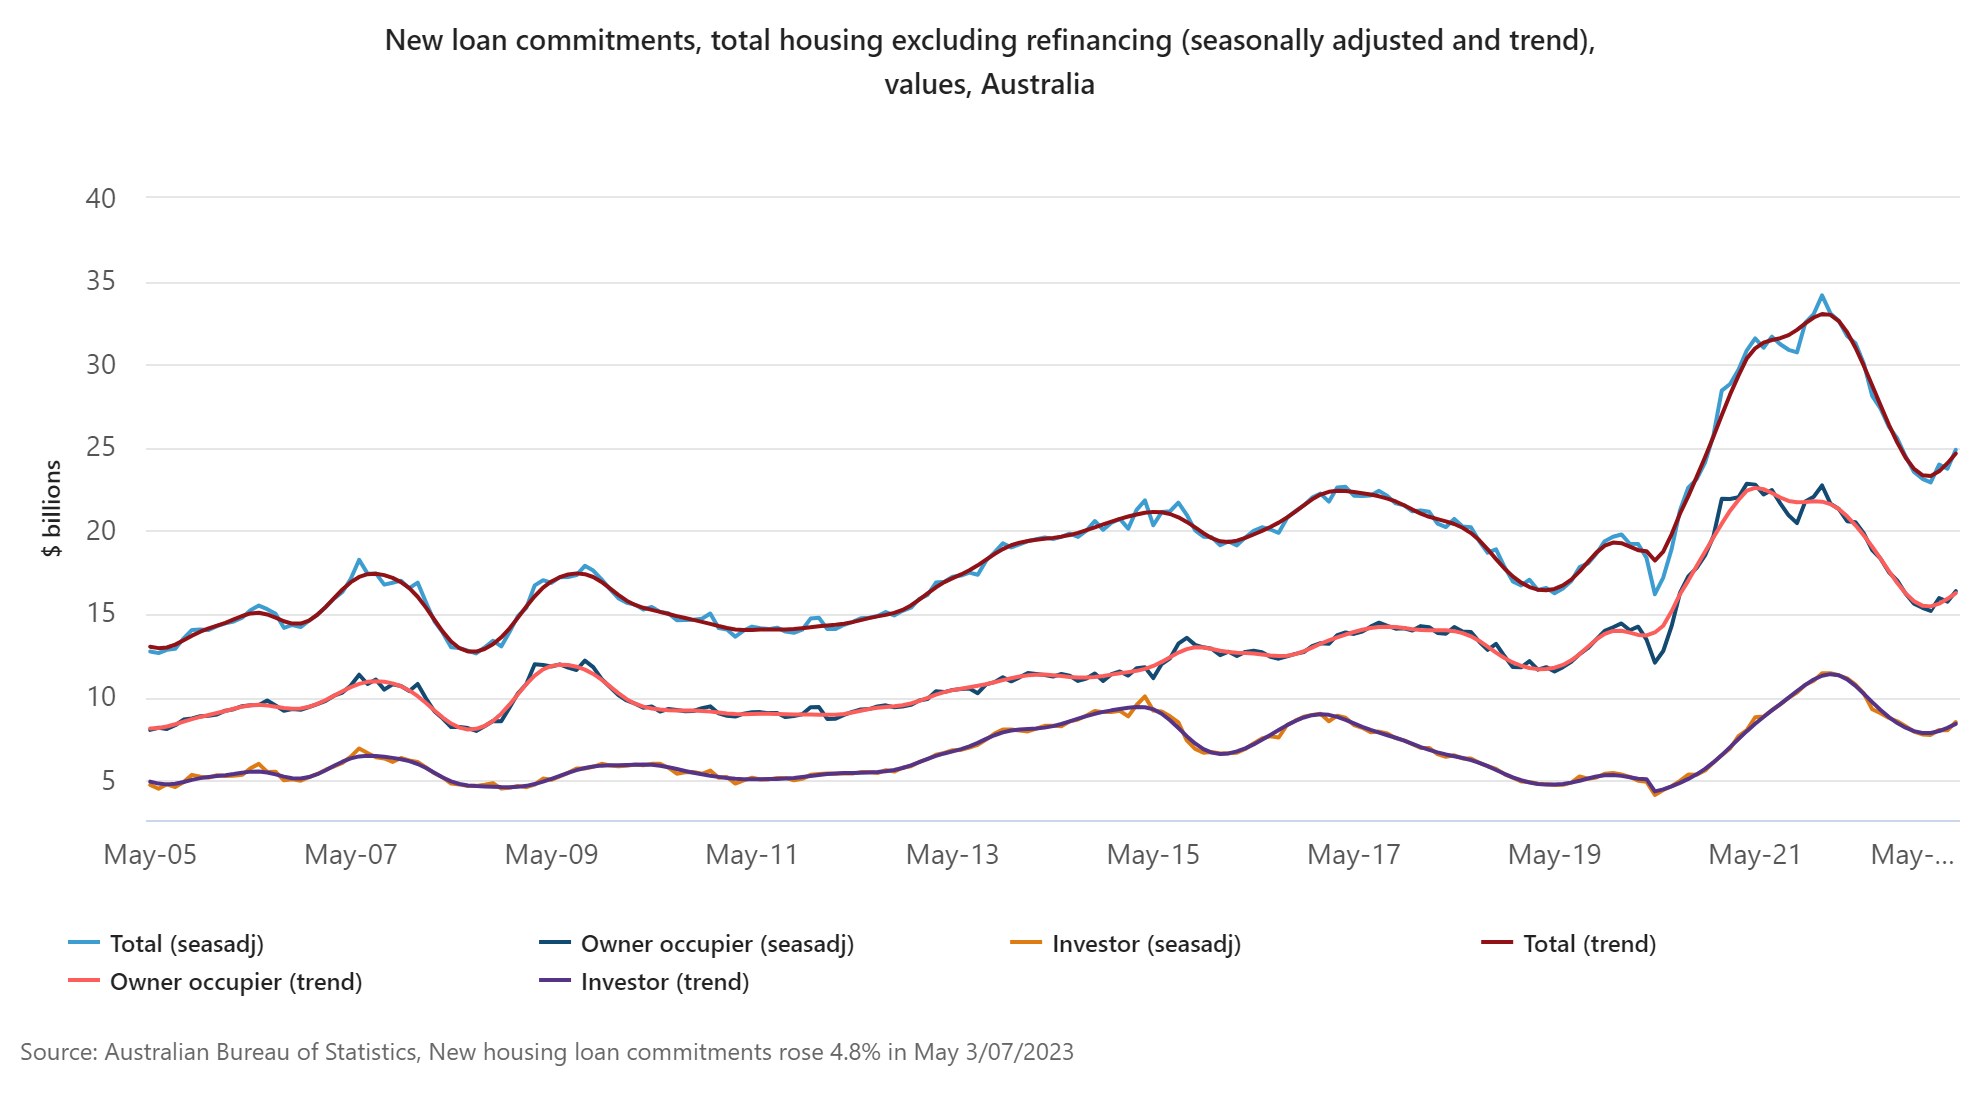
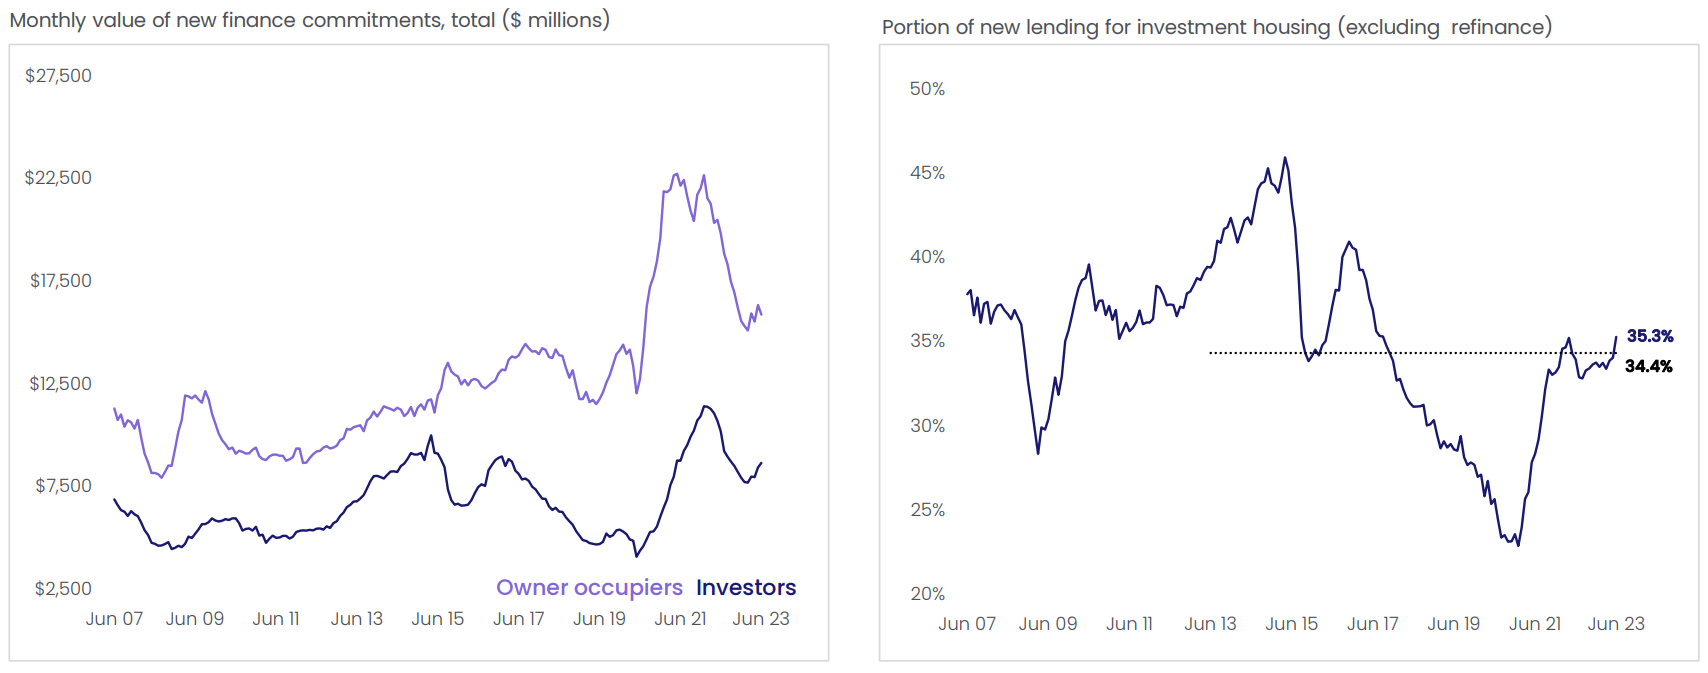
The value of loans for new investors went up by 6.2%, hitting a total of $8.5 billion. This is happening all across the country and approximately one-third of all the home loans are going to investors. Additionally, vacancy rates are at an all-time low, meaning investment properties are not sitting empty without anyone paying rent. Considering that there has been a pause in interest rate hikes for the last two consecutive months, demand from property investors is expected to continue to increase into 2024.
Over a third of all housing credit went toward property investing
The total value of financing people borrowed for homes went down by 1.0% in June. This came after a strong increase of 5.4% in May. The decrease was led by the owner-occupier, non-first home buyer segment, which was down -1.9% in the month. First-home buyer lending rose 4.3%, while investment finance increased 2.6%.
Across Australia, about 35.3% of the new money borrowed for mortgages was for investing. This went up from 34.1% in the month before. This data shows that more people were putting their money into buying homes to rent out or sell later, compared to those who were borrowing to buy a home for themselves to live in.
The Australian housing market witnessed a notable rise in dwelling values and sales volumes, while rental dynamics displayed a prolonged growth trend, offering potential opportunities for investors, even as housing credit trends reflected varying borrowing patterns among different segments of buyers and investors.
Interested in investing?
Delve deeper into this dynamic market with informed choices. Let us guide you through the intricate landscape, providing expert insights, comprehensive knowledge and valuable education for a successful investment journey.


Get Started
Every success story starts with a leap of faith. Start a conversation with us.