
Australian housing market defies challenges: CoreLogic November housing chart update
21 November 2023
The November Monthly Housing Chart Pack by CoreLogic offers a comprehensive review of the progress in the Australian housing market until the end of October 2023.
Navigating interest rate challenges
Despite facing 13 interest rate hikes from the Reserve Bank of Australia (RBA), resulting in a 4.25% increase in official rates over the past year, property prices have not only held their ground but continued to rise.
The RBA’s November rate hike is poised to add pressure on mortgage holders. However, the persistent lack of supply, coupled with robust demand from our surging population, is poised to be a catalyst for upward growth in our housing markets.
The current economic climate, marked by inflationary concerns and the Australian economy’s strong growth, signals that the road ahead may not be without its challenges.
Here’s a snapshot of what happened in October:
- Australian real estate made a turnaround despite challenges: high inflation, rising interest rates, recession fears, and low consumer confidence.
- The combined value of residential real estate reached $10.2 trillion in October, up from $10.1 trillion the previous month – indicating the continued importance of the role of real estate in Australia’s economic wealth.
- Dwelling values in combined capitals rose 0.9% in October, showing a slight acceleration but easing from the May peak of 1.5%.
- Combined regional property values increased by a modest 1.5% over the last three months.
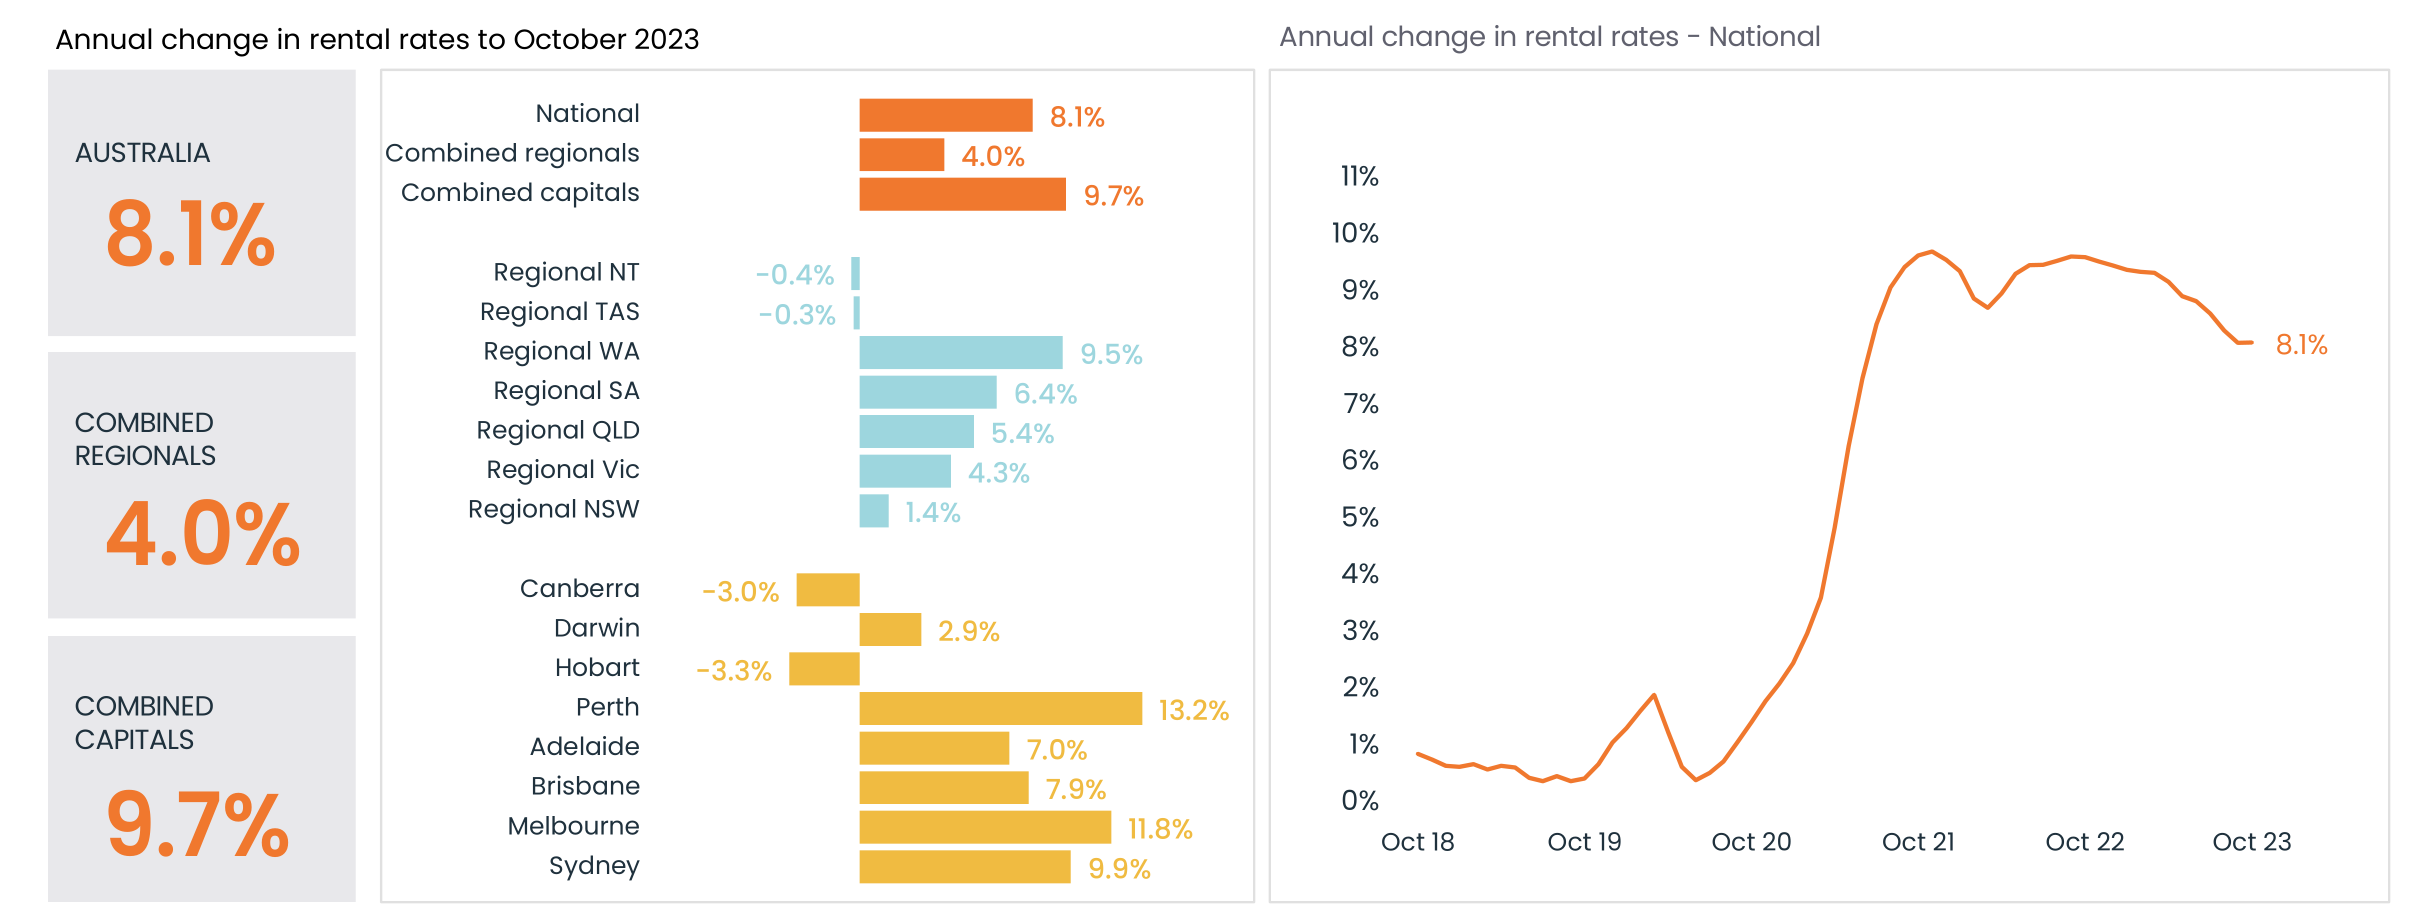
- Australian rent values grew by 0.7% in October, reflecting a significant 8.1% annual increase. Annual growth in rent values, although elevated, shows signs of easing, particularly in regional Australia.
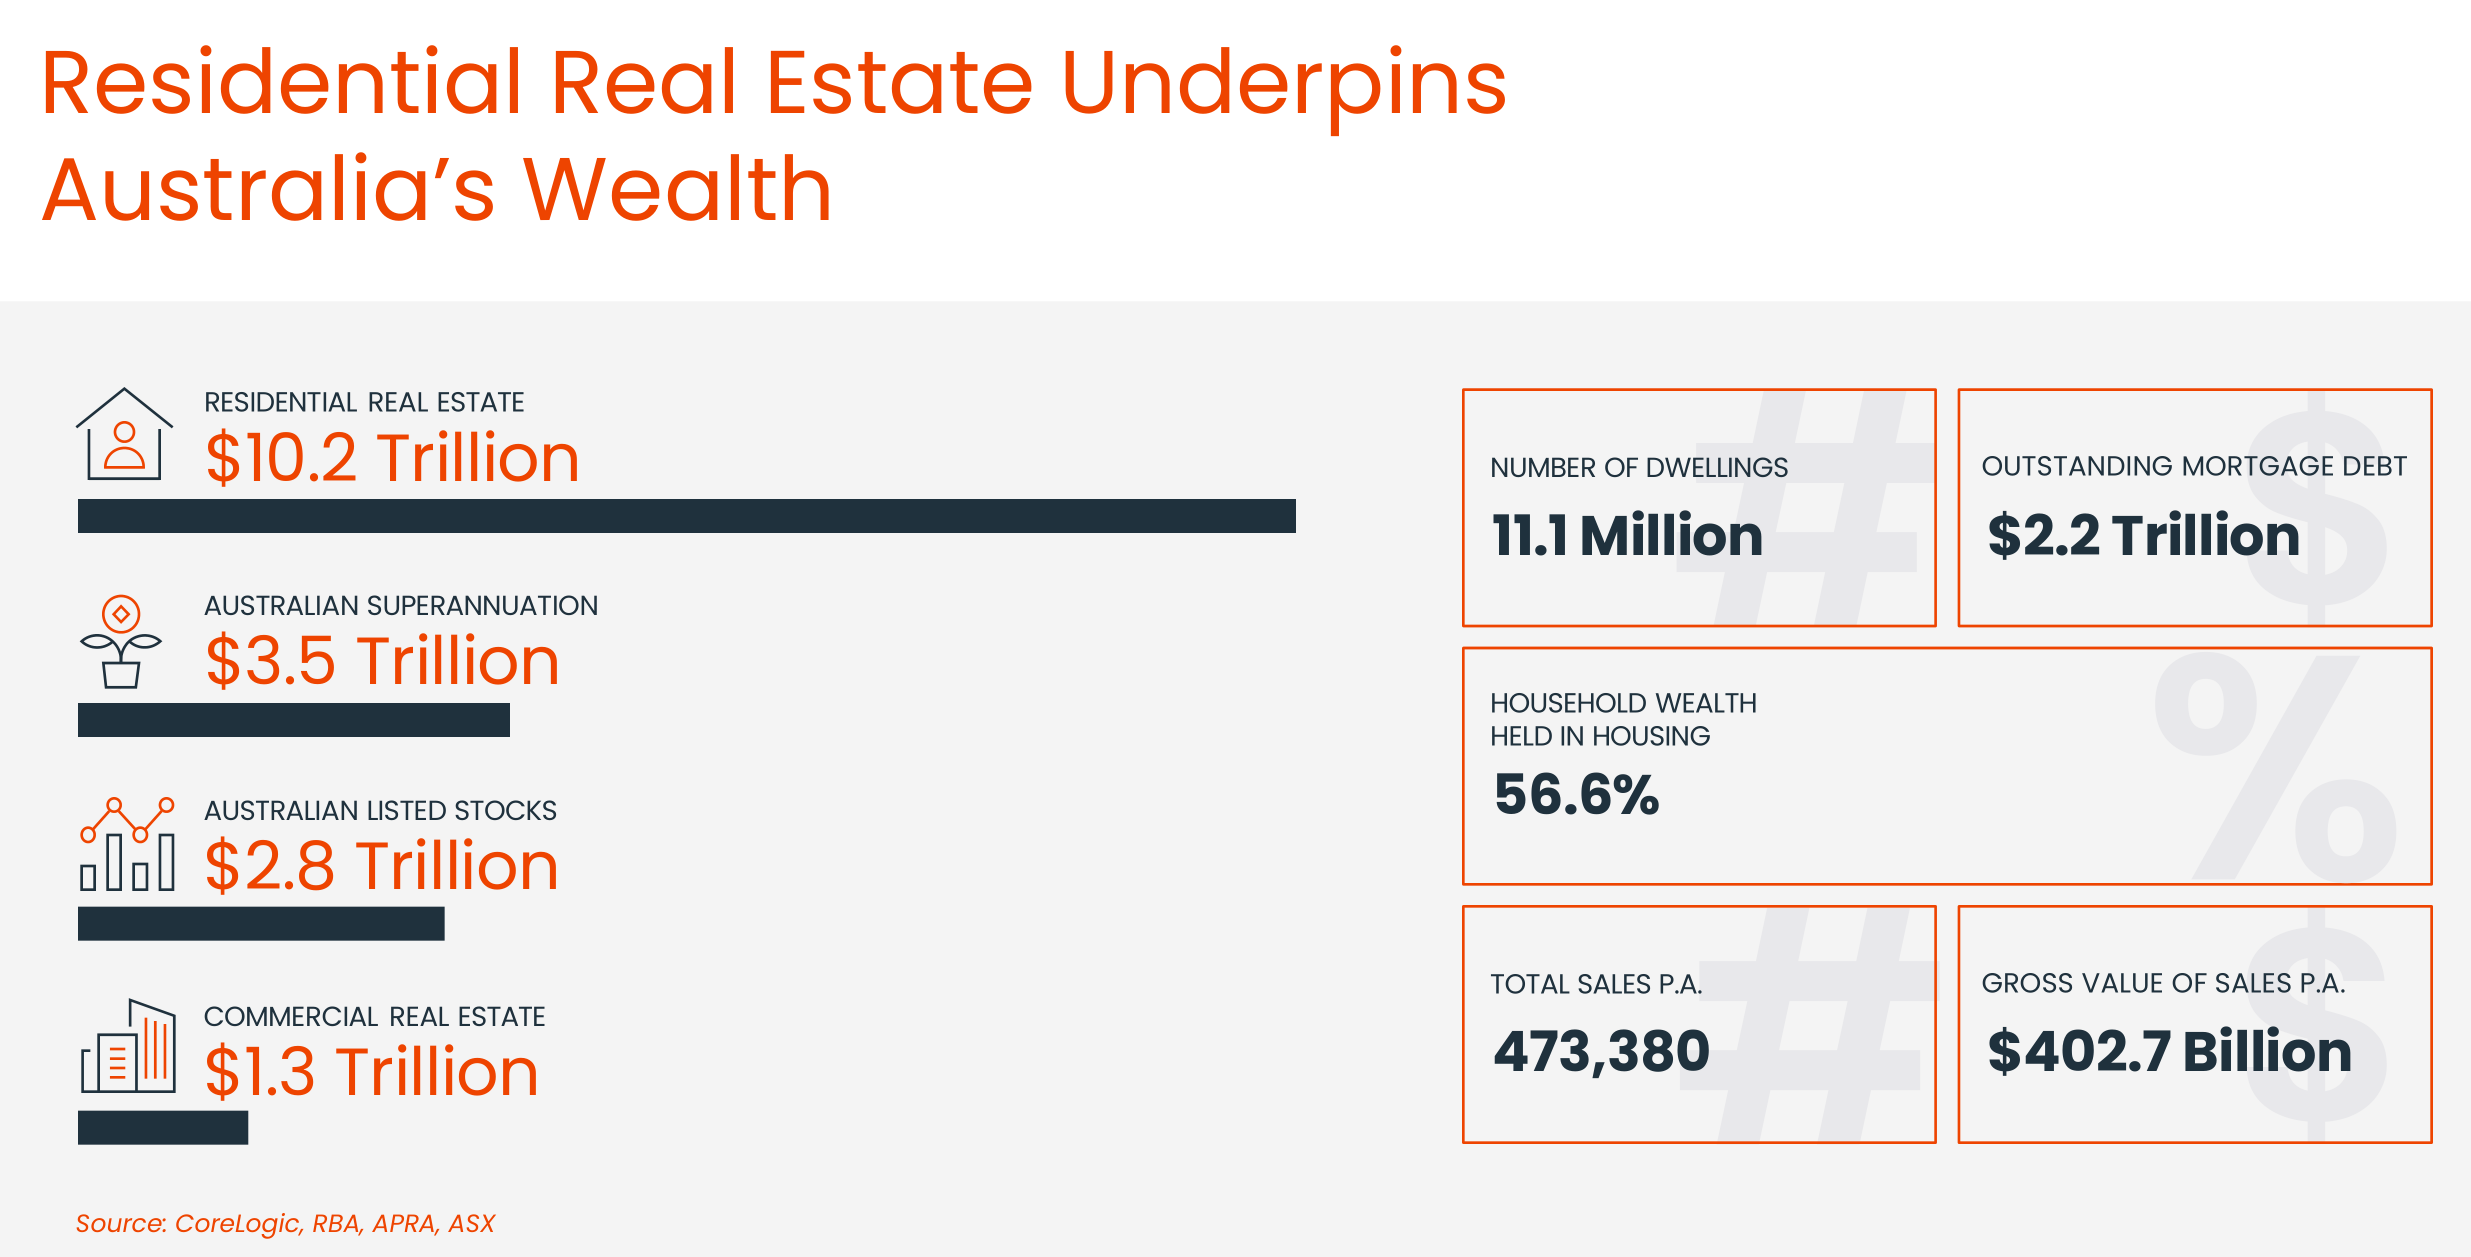
Residential real estate plays a pivotal role in Australia’s economic wealth
Residential real estate plays a foundational role in Australia’s economic wealth. In October, the nation’s residential real estate market soared to unprecedented levels, reaching $10.2 trillion.
This significant surge in the overall value of residential real estate implies the potential for continued growth in property values and equity.
Particularly noteworthy is the fact that 56.6% of the total wealth held by Australian households is tied to residential property investments.
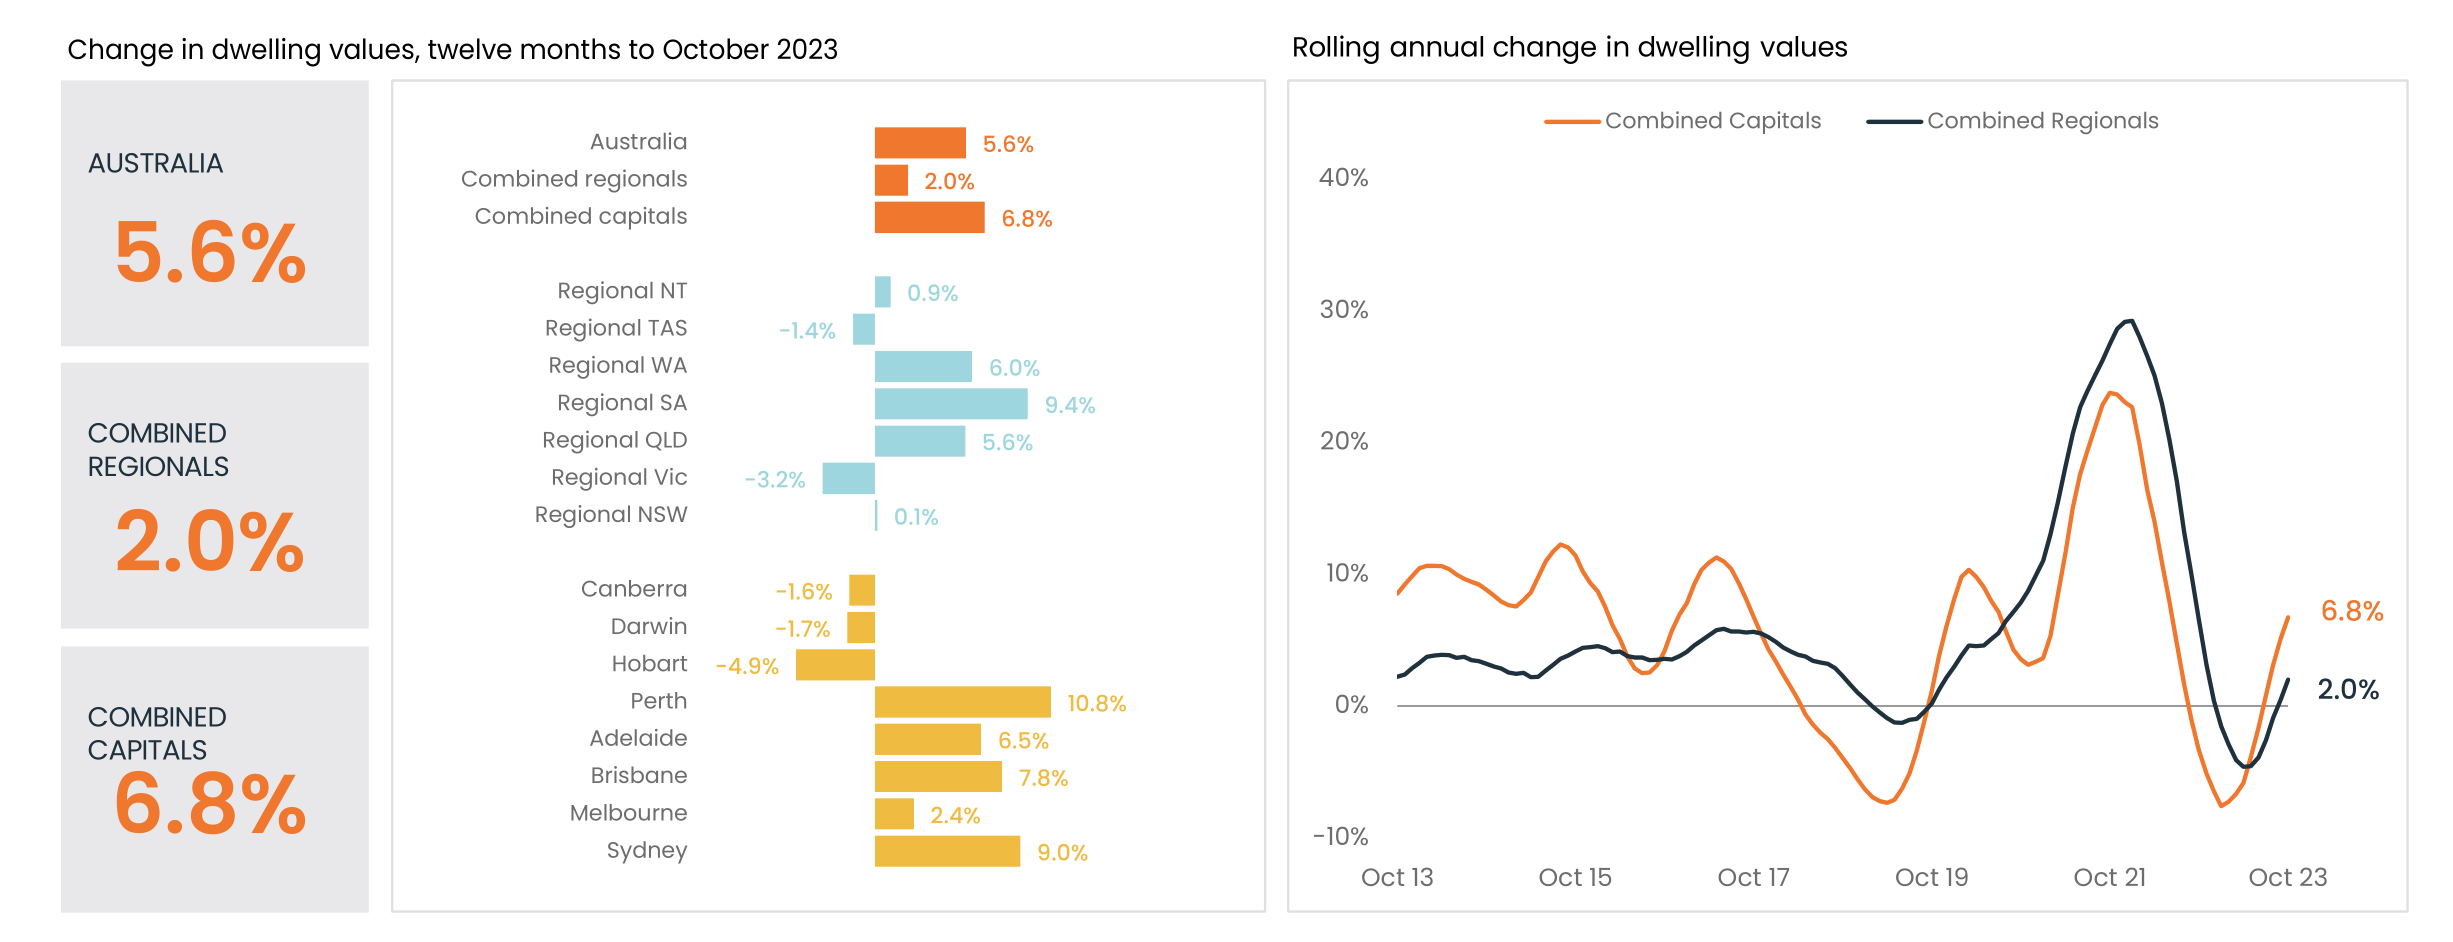
Dwelling values continue to defy rising rates
Dwelling values in the combined capitals experienced a 0.9% rise in October. Although this signifies a slight acceleration compared to the previous month, the monthly growth across capital cities has generally tapered off since peaking at 1.5% in May.
Contrastingly, the combined regional property values exhibited a more moderate growth, increasing by 1.5% over the last three months. The divergence in growth rates between capital cities and regional areas underscores the varied dynamics within Australia’s property market.
The positive trend in capital city home sales is indicative of persistently low levels of available housing supply intersecting with escalating housing demand. This heightened competition among buyers has introduced an element of Fear of Missing Out (FOMO) into the market, amplifying the urgency among potential homebuyers.
Despite the overall positive trend, it is essential to note that Australia’s property markets are not uniform; while most segments are experiencing growth, some areas are still languishing.
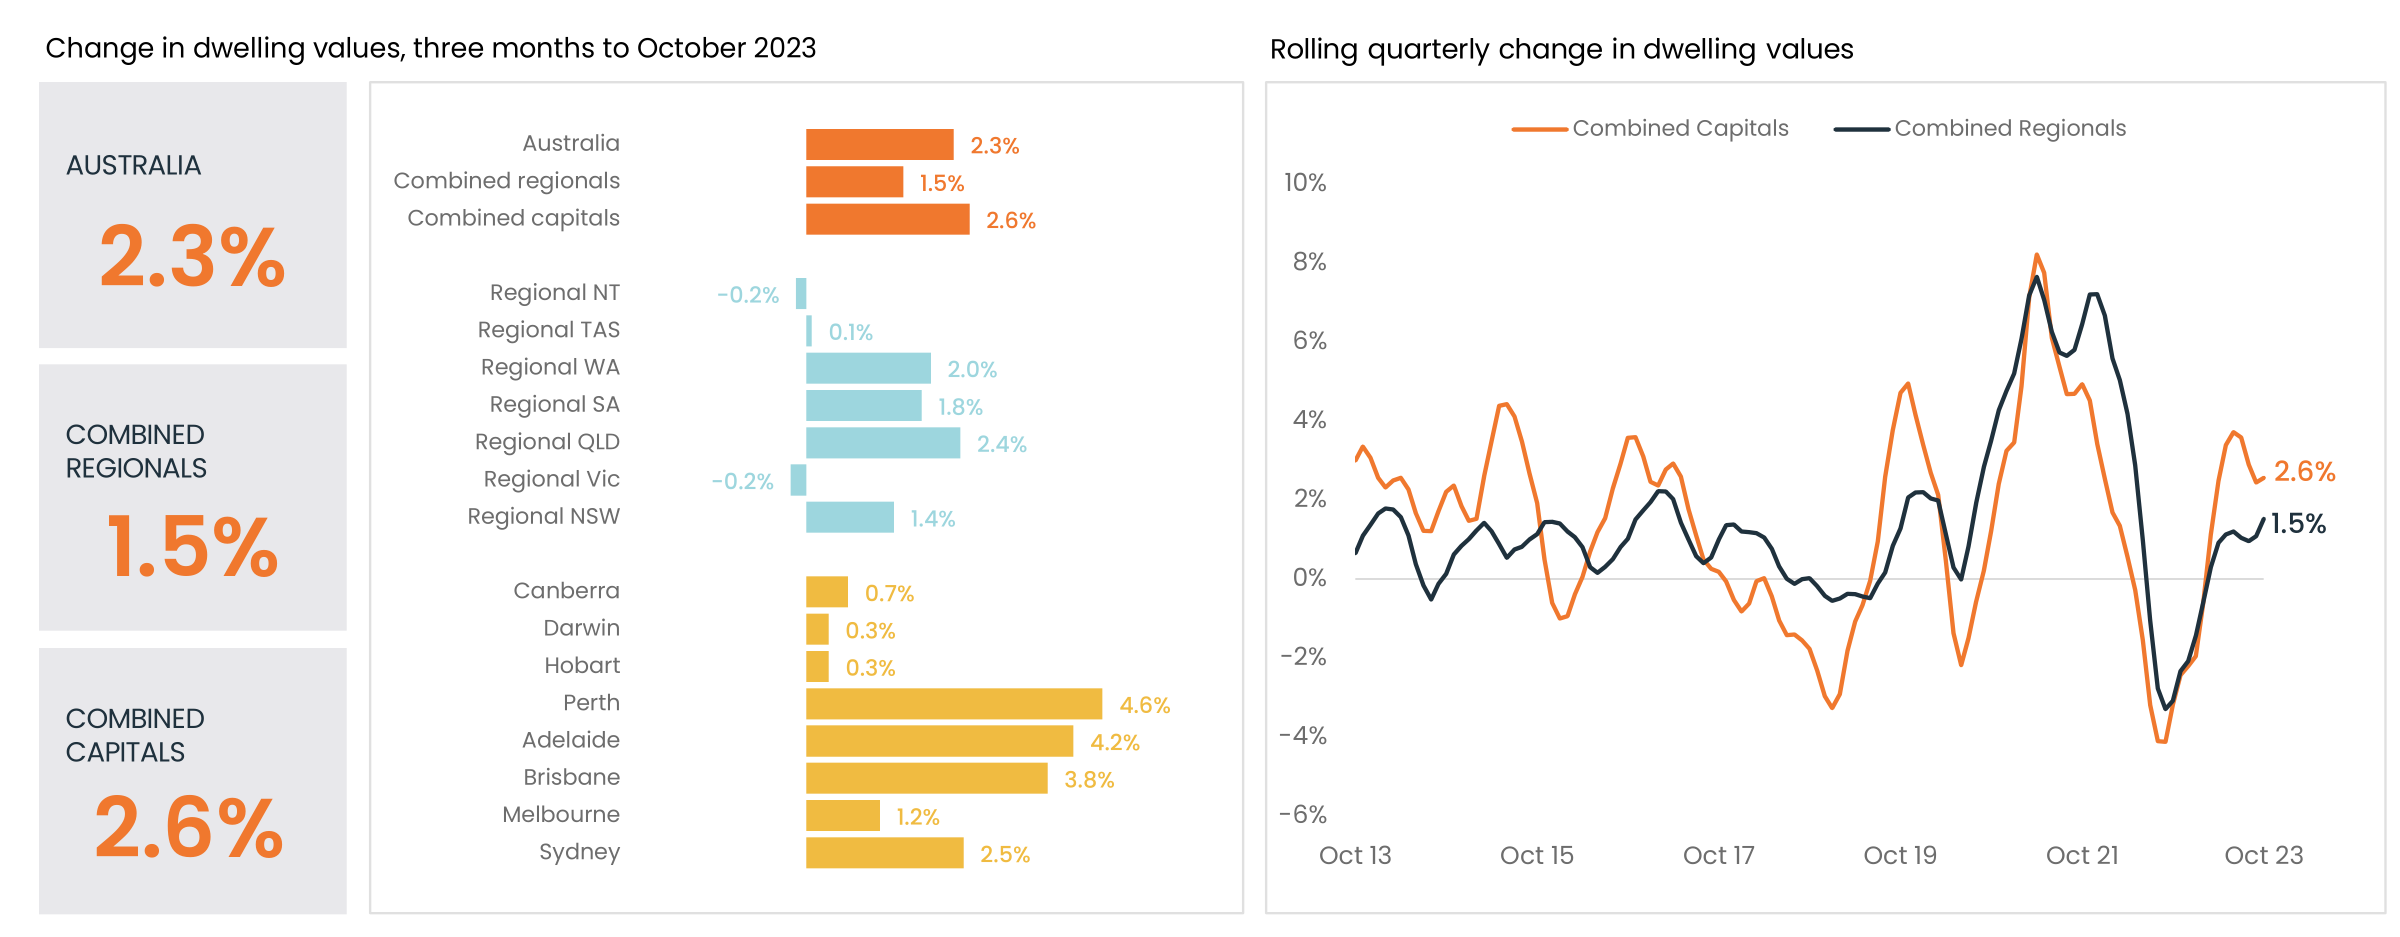
National home values experienced a 2.3% rise in the three months leading up to October, showing a slight easing from the recent peak of 3.1% in the June quarter. Over the year to October, home values saw a notable increase of 5.6%, marking the highest annual rate of growth since July 2022.
A glance at the table below reveals that the rate of growth in capital cities is surpassing that of regional Australia. The continued upward trajectory in national home values, albeit at a slightly slower pace, indicates a resilient and robust market.
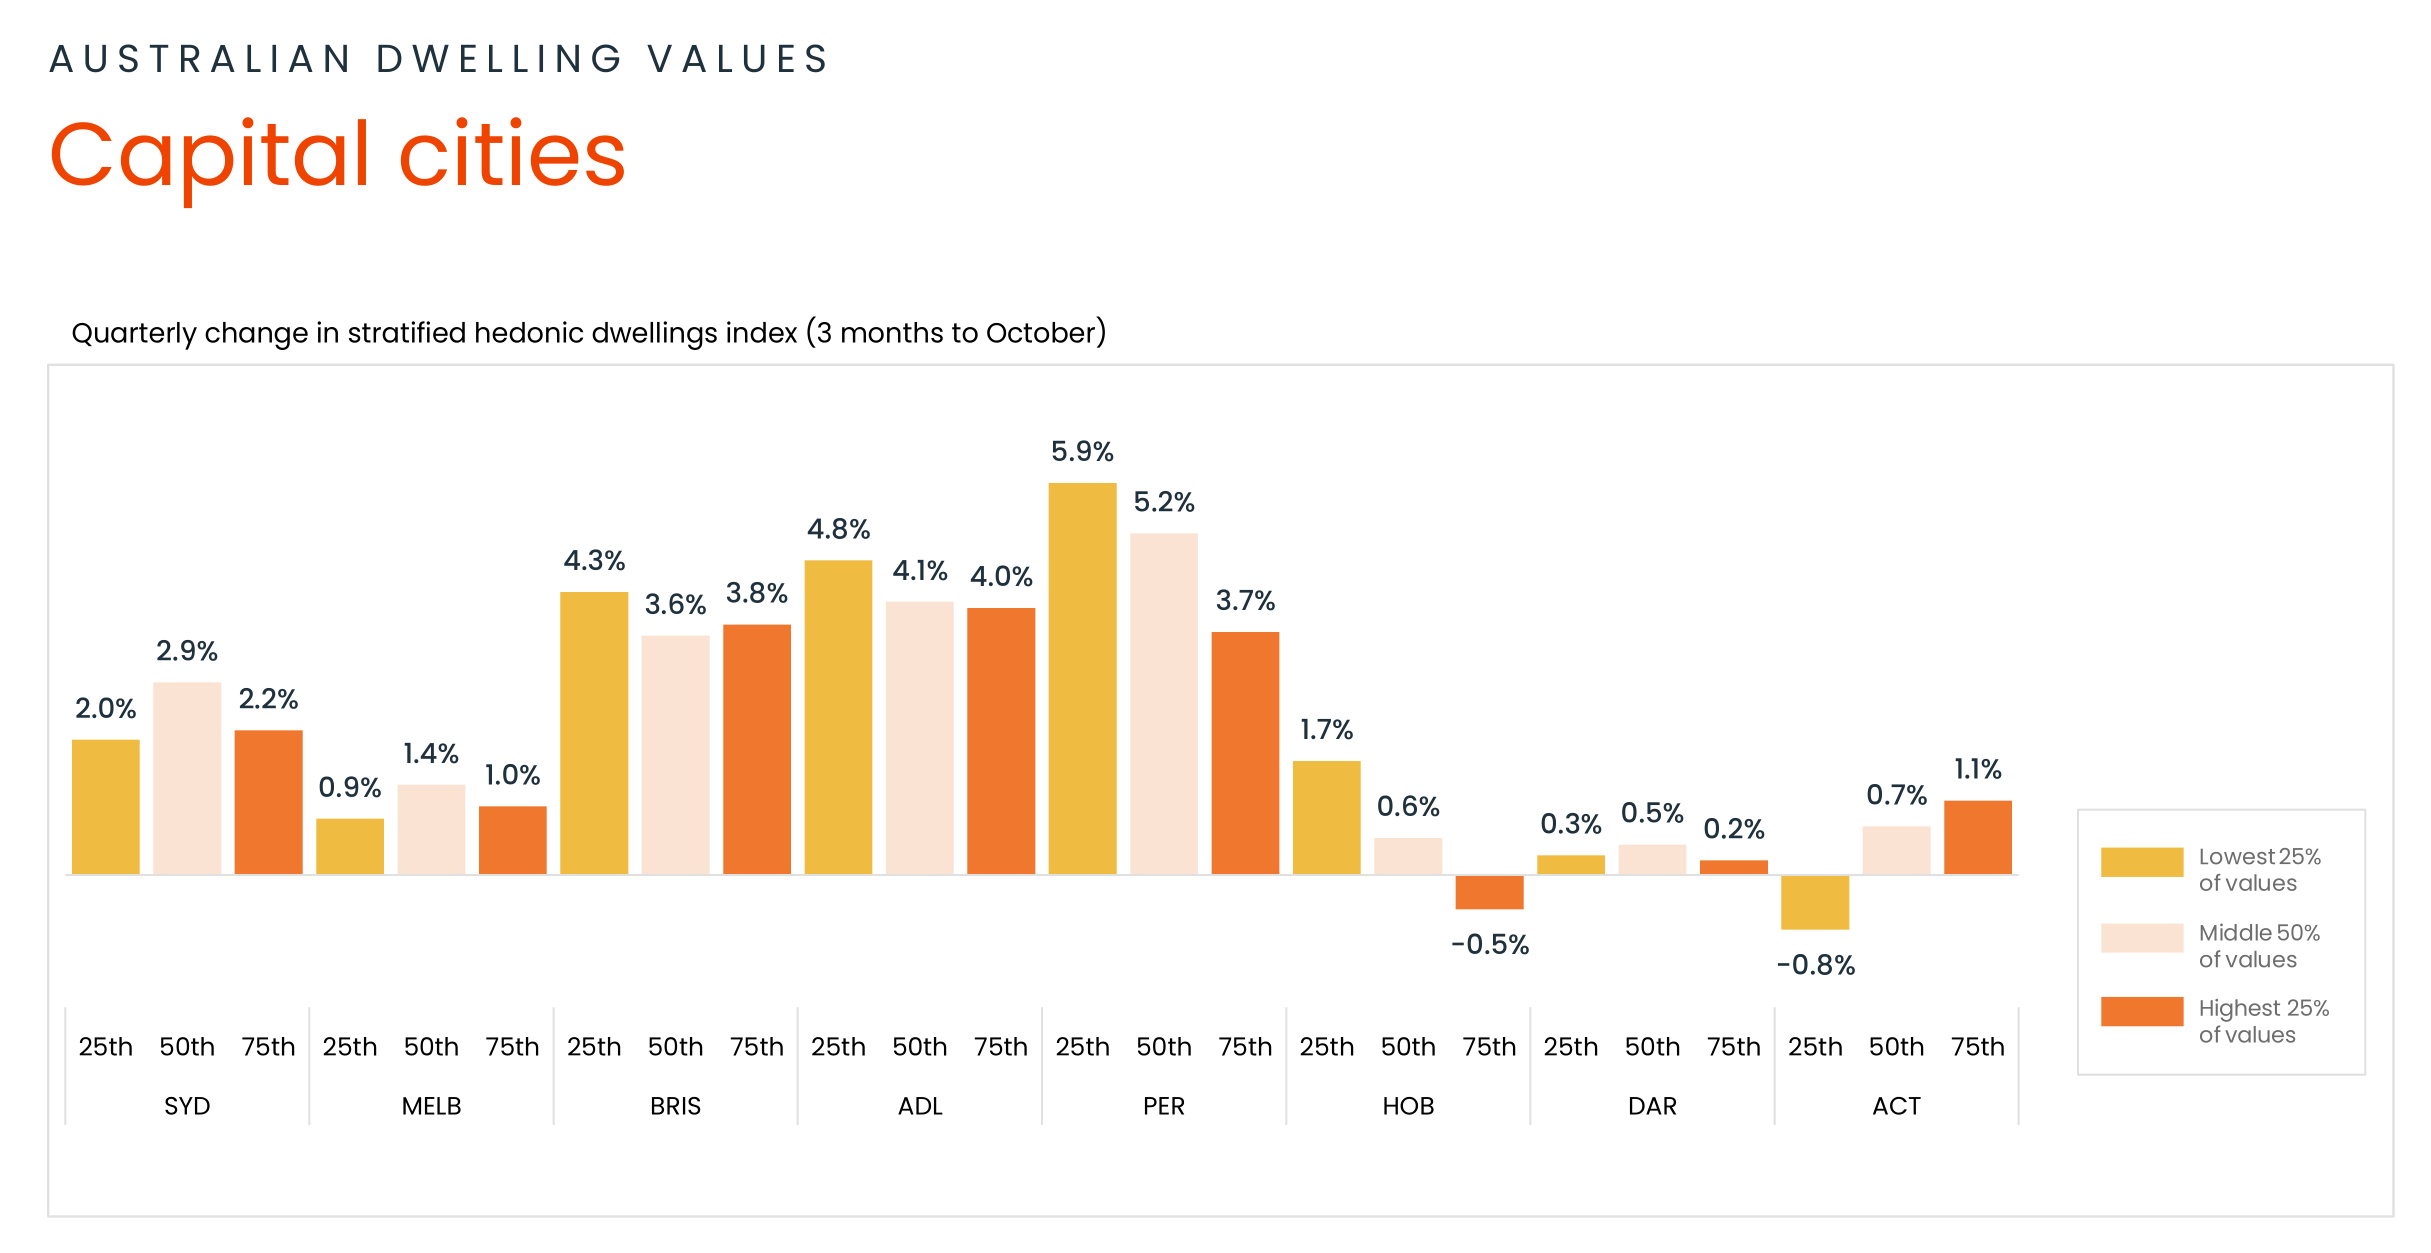
Diverse investment opportunities for Australia’s fragmented property market
As mentioned earlier, there is evident fragmentation in the housing markets across states, and the more expensive market segments significantly influence both the initial decline and subsequent recovery. This pattern is not a recent development; historically, the upper quartile of housing markets has consistently displayed greater volatility.
The chart visually depicts the divergent performance among various segments within each capital city market.
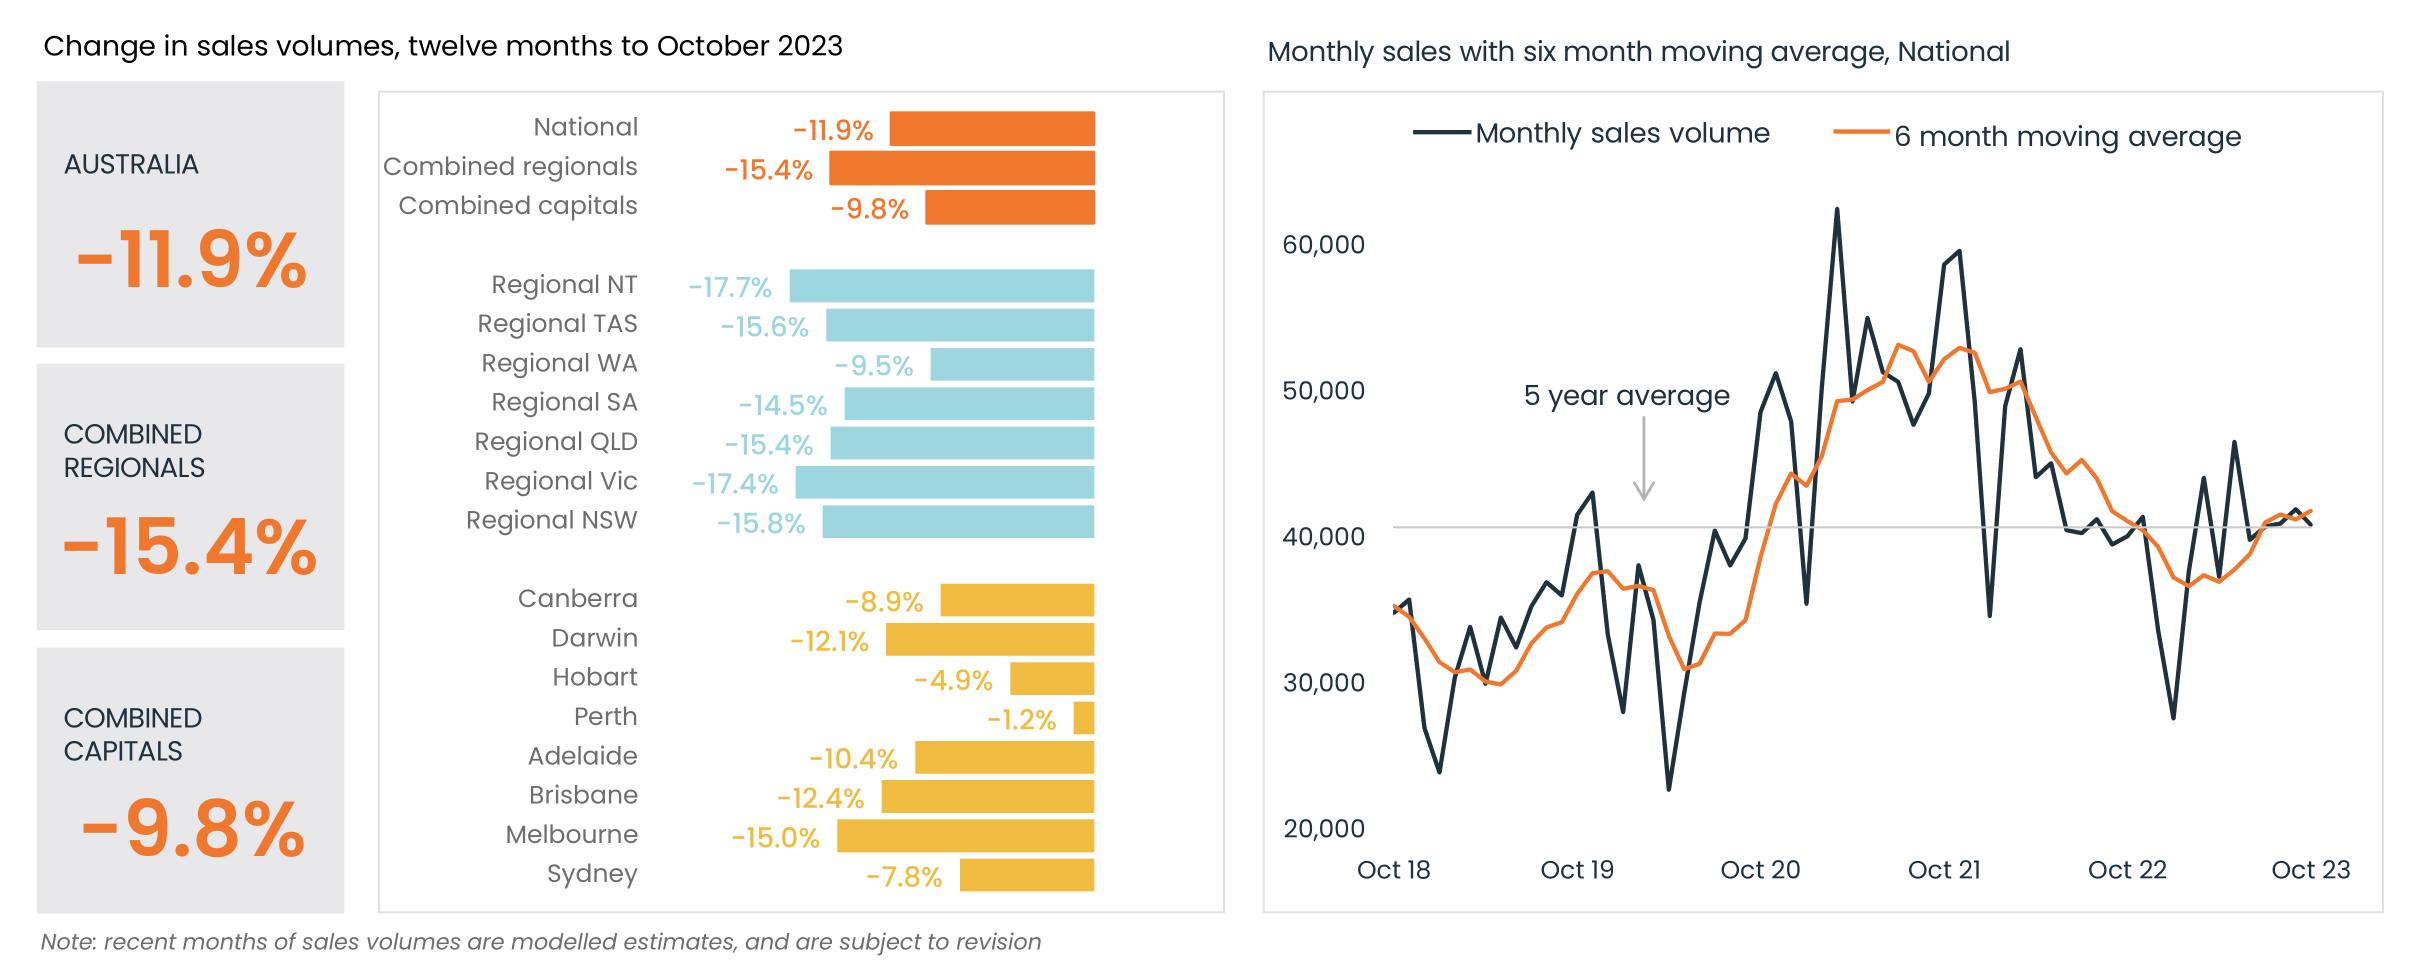
Sales volume trends showing signs of resilience in the market
Sales volumes are trending at levels closer to their historic monthly five-year average with CoreLogic estimating 40,993 sales in October nationally.
The six-month moving trend shows sales volumes are gradually increasing, even though they are below the highs of 2021, suggesting a potential recovery and resilience in the market.
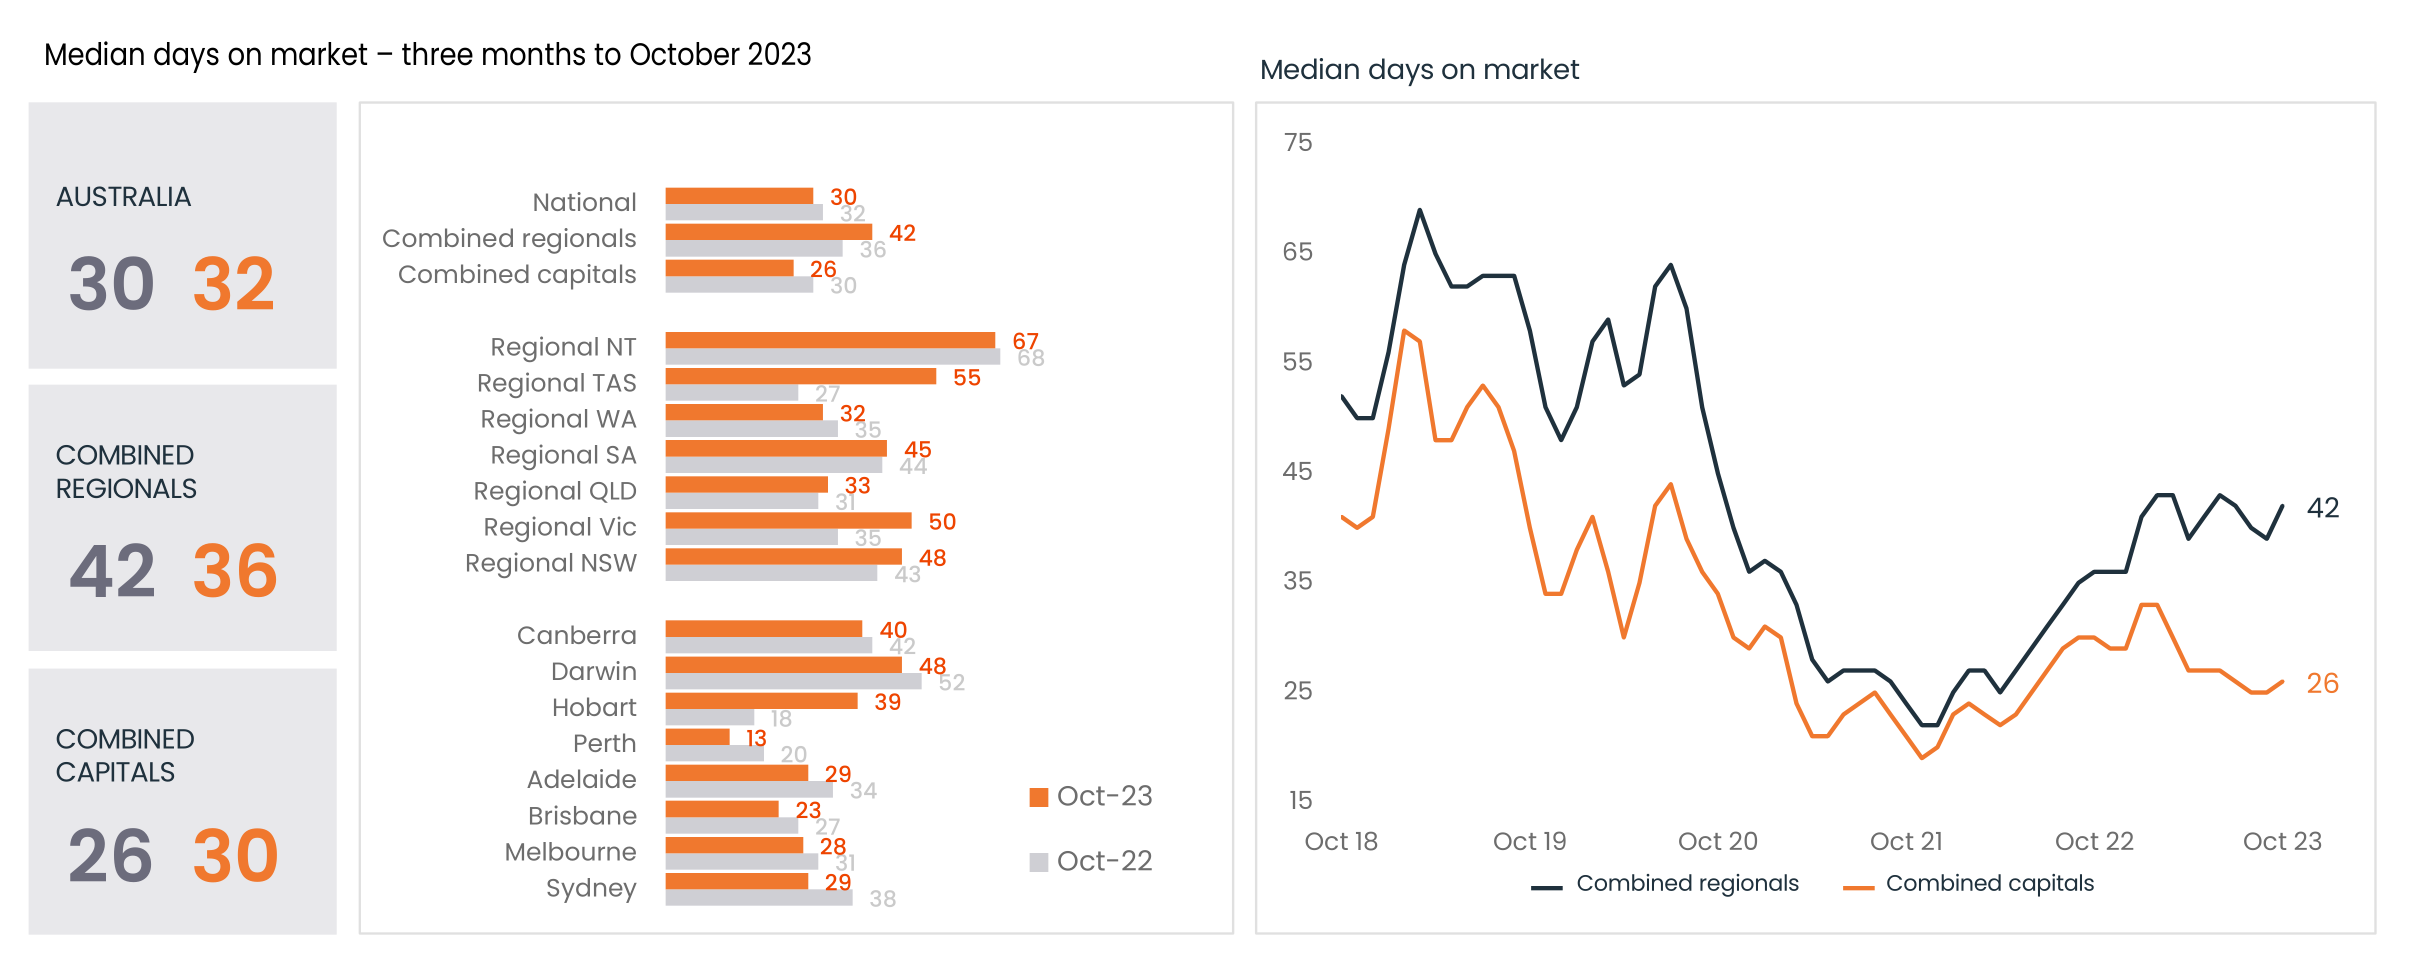
Moved into a more balanced market
The amount of time it takes to sell a property experienced a slight increase over the three months leading to October, with the national median days on the market reaching 30 days.
Year-on-year, selling conditions have improved in the combined capitals, with the median selling time now at 26 days compared to 30 days in the corresponding period of 2022.
The improved year-on-year selling conditions in the combined capitals indicate continued resilience.
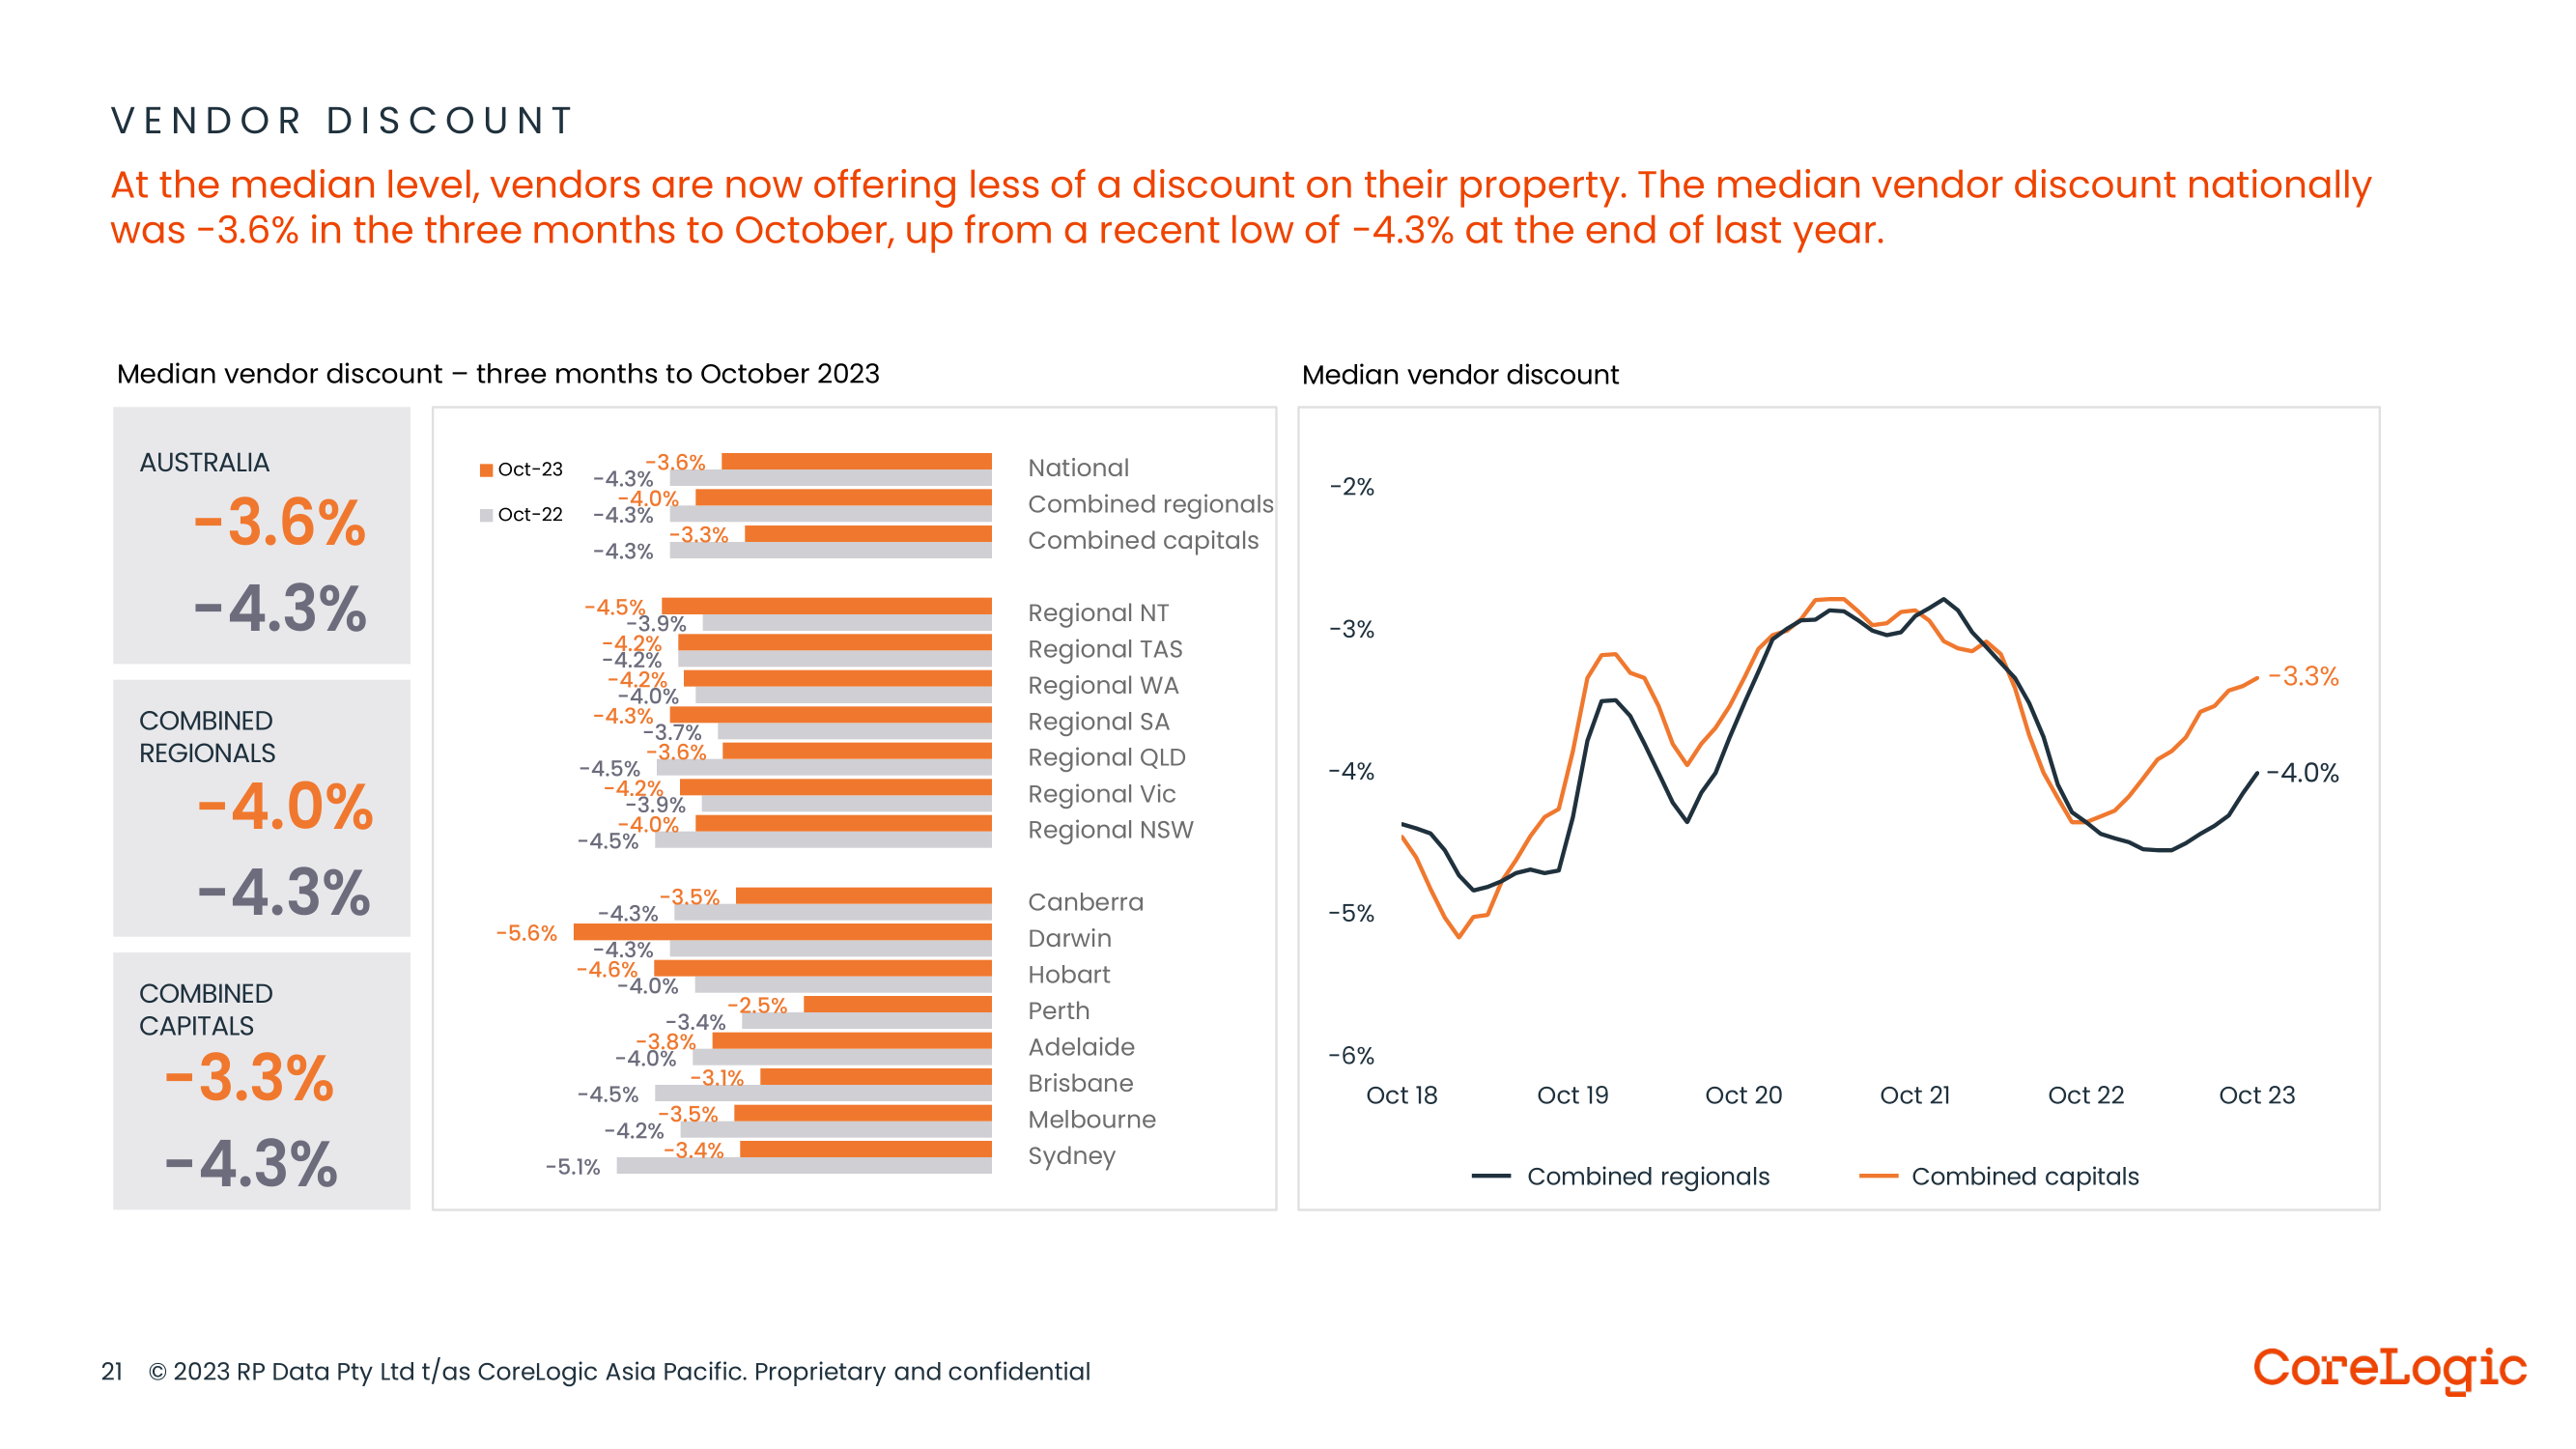
Vendor competitiveness
Sellers, on average, are becoming less inclined to provide discounts on their properties. Nationally, the median vendor discount stood at -3.6% in the three months leading up to October, marking an increase from a recent low of -4.3% recorded at the end of the previous year.
This shift indicates a potential adjustment in the bargaining power between buyers and sellers, with sellers exhibiting a reduced willingness to compromise on property prices.
How many properties are available for sale at the moment?
The market dynamics in the four weeks leading up to November 5 reveal important trends:
- New Listings: Nationally, there were 43,421 new property listings during this period, reflecting an ongoing trend of increasing supply.
- Seasonal Trend: New listings have seen a consistent upward trend from winter into the beginning of spring, currently standing at 10.2% higher than a year ago. However, they remain -5.4% lower than the previous 5-year average.
- Quality Property Challenge: Despite the rise in listings, there’s a notable scarcity of A-grade homes or investment-grade properties. Owners of high-quality properties are holding onto them, limiting the availability of premium assets.
- Overall Listings: At the national level, a total of 155,478 listings were observed over the four weeks to November 5, indicating a substantial volume of properties on the market.
- Listing Increase: Total listings are gradually increasing, boosted by the rise in new listings, and are now 4.2% higher than a month ago.
- Market Variation: It’s crucial to note that while total listings are on the rise nationally, specific markets may experience varying trends, with some witnessing an increase.
This information underscores the evolving landscape for property investors, emphasizing the need for careful consideration of quality, investment grade properties and a nuanced approach to navigate the changing supply dynamics in different markets.
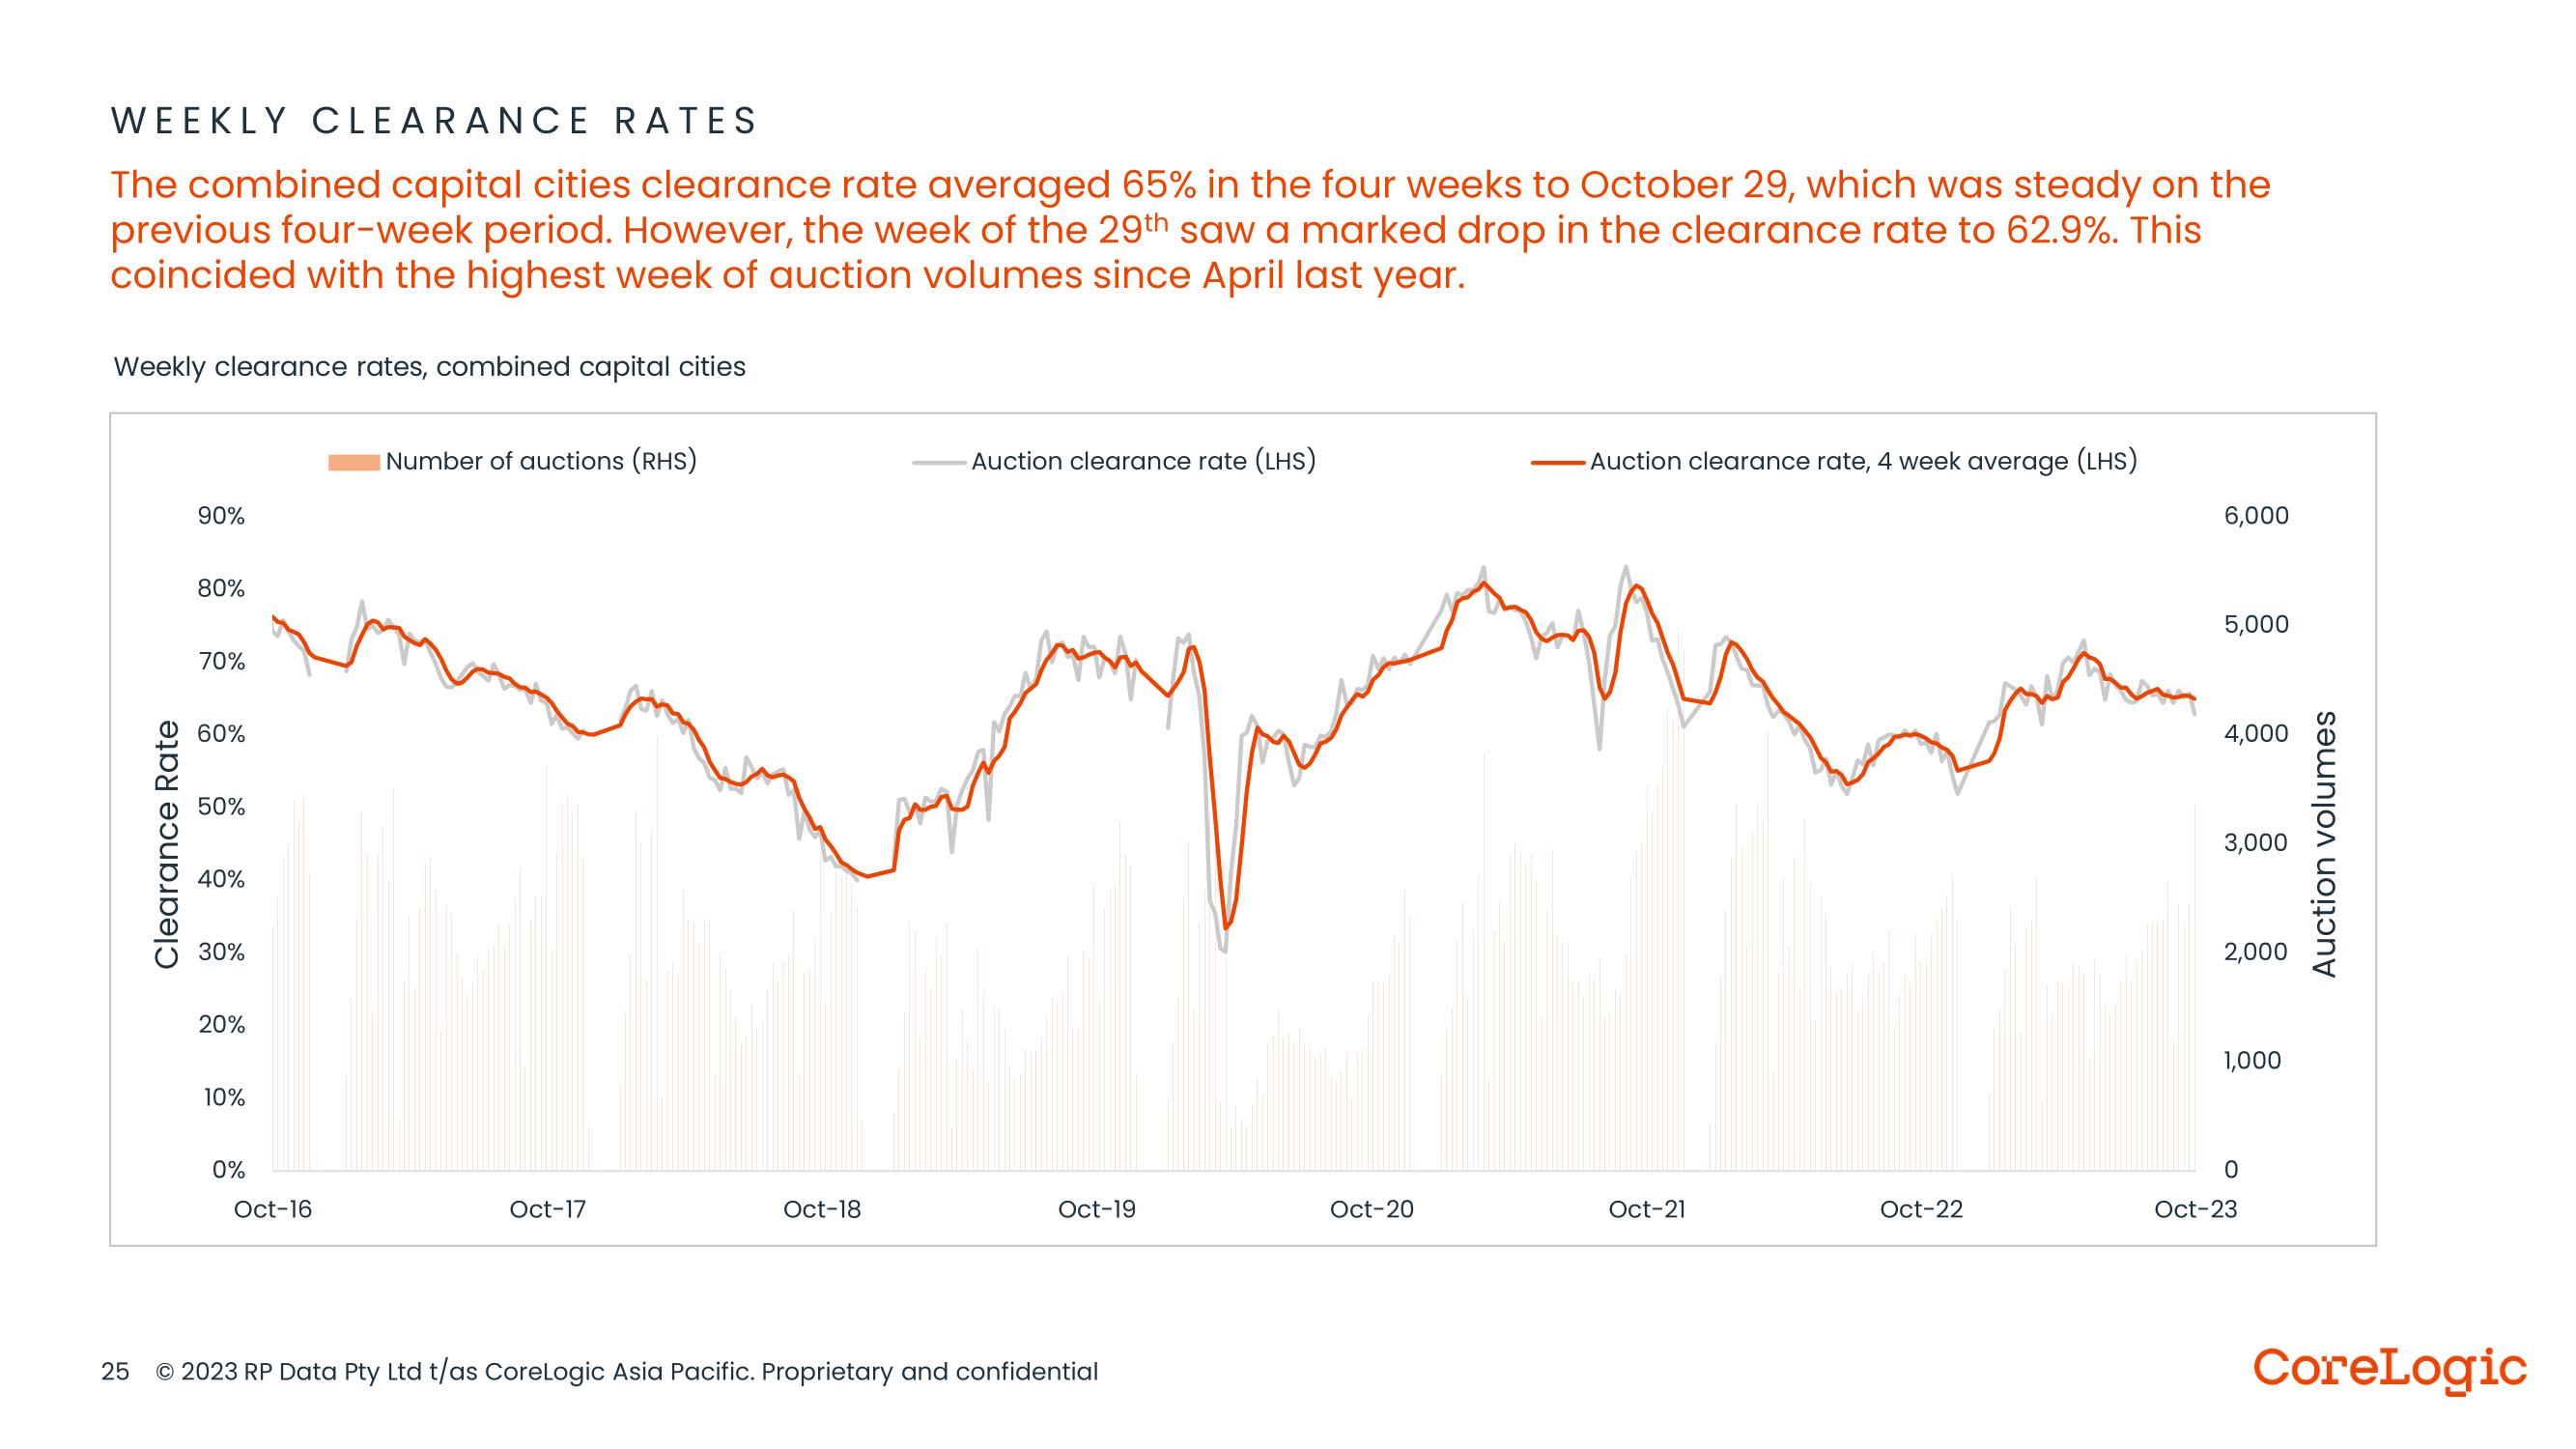
Auction clearance rates confirm a turn in the property cycle
Auction clearance rates are a good timely indicator of the strength of our property market. While the clearance rate maintained an average of 65% over the four weeks leading up to October 29, signaling relative stability, there was a significant drop to 62.9% during that specific week to October 29th. This decline coincided with the highest week of auction volumes since April of the previous year.
These shifts indicate a potential shift in market dynamics. A decrease in the clearance rate may indicate increased competition among sellers or a temporary imbalance between supply and demand. The surge in auction volumes adds another layer to this observation, suggesting a heightened level of market activity during that period.
Are we still experiencing a rental market crisis?
The Australian rental market is currently experiencing a critical situation:
- Rising Rent Values: In October, Australian rent values increased by a further 0.7%, contributing to a national annual increase of 8.1% on the back of record levels of low vacancy rates across the country.
- Elevated Annual Growth: While the annual growth in rent values remains higher than the previous decade’s average, there are indications of a slowdown in this upward trend.
- Regional Impact: Notably, the easing of growth in rent values is most prominent in regional Australia.
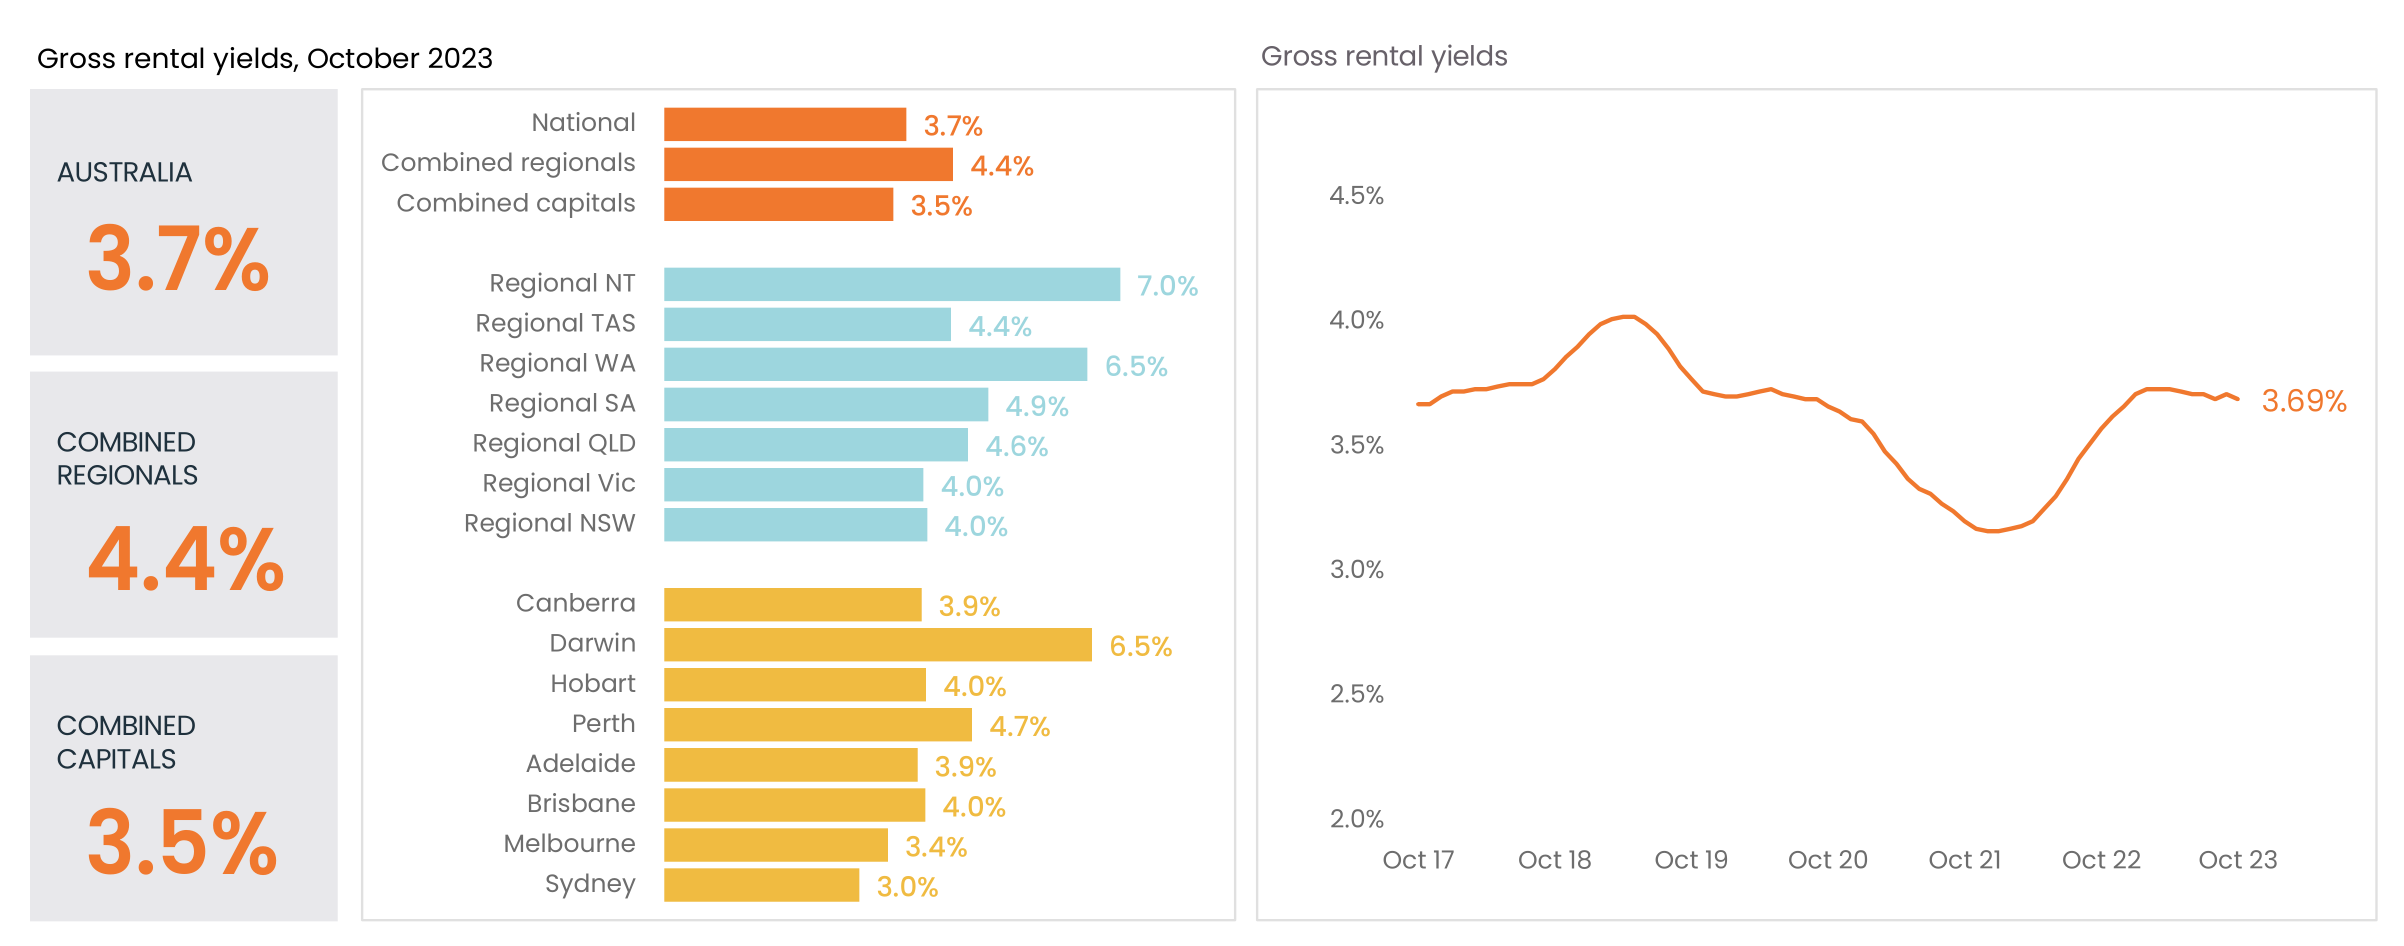
- Value vs. Rent Dynamics: Over the past five months, housing values have outpaced rent increases. This shift is leading to a slight compression in gross rent yields on a national scale, dropping from 3.71% in the previous month to 3.69%.
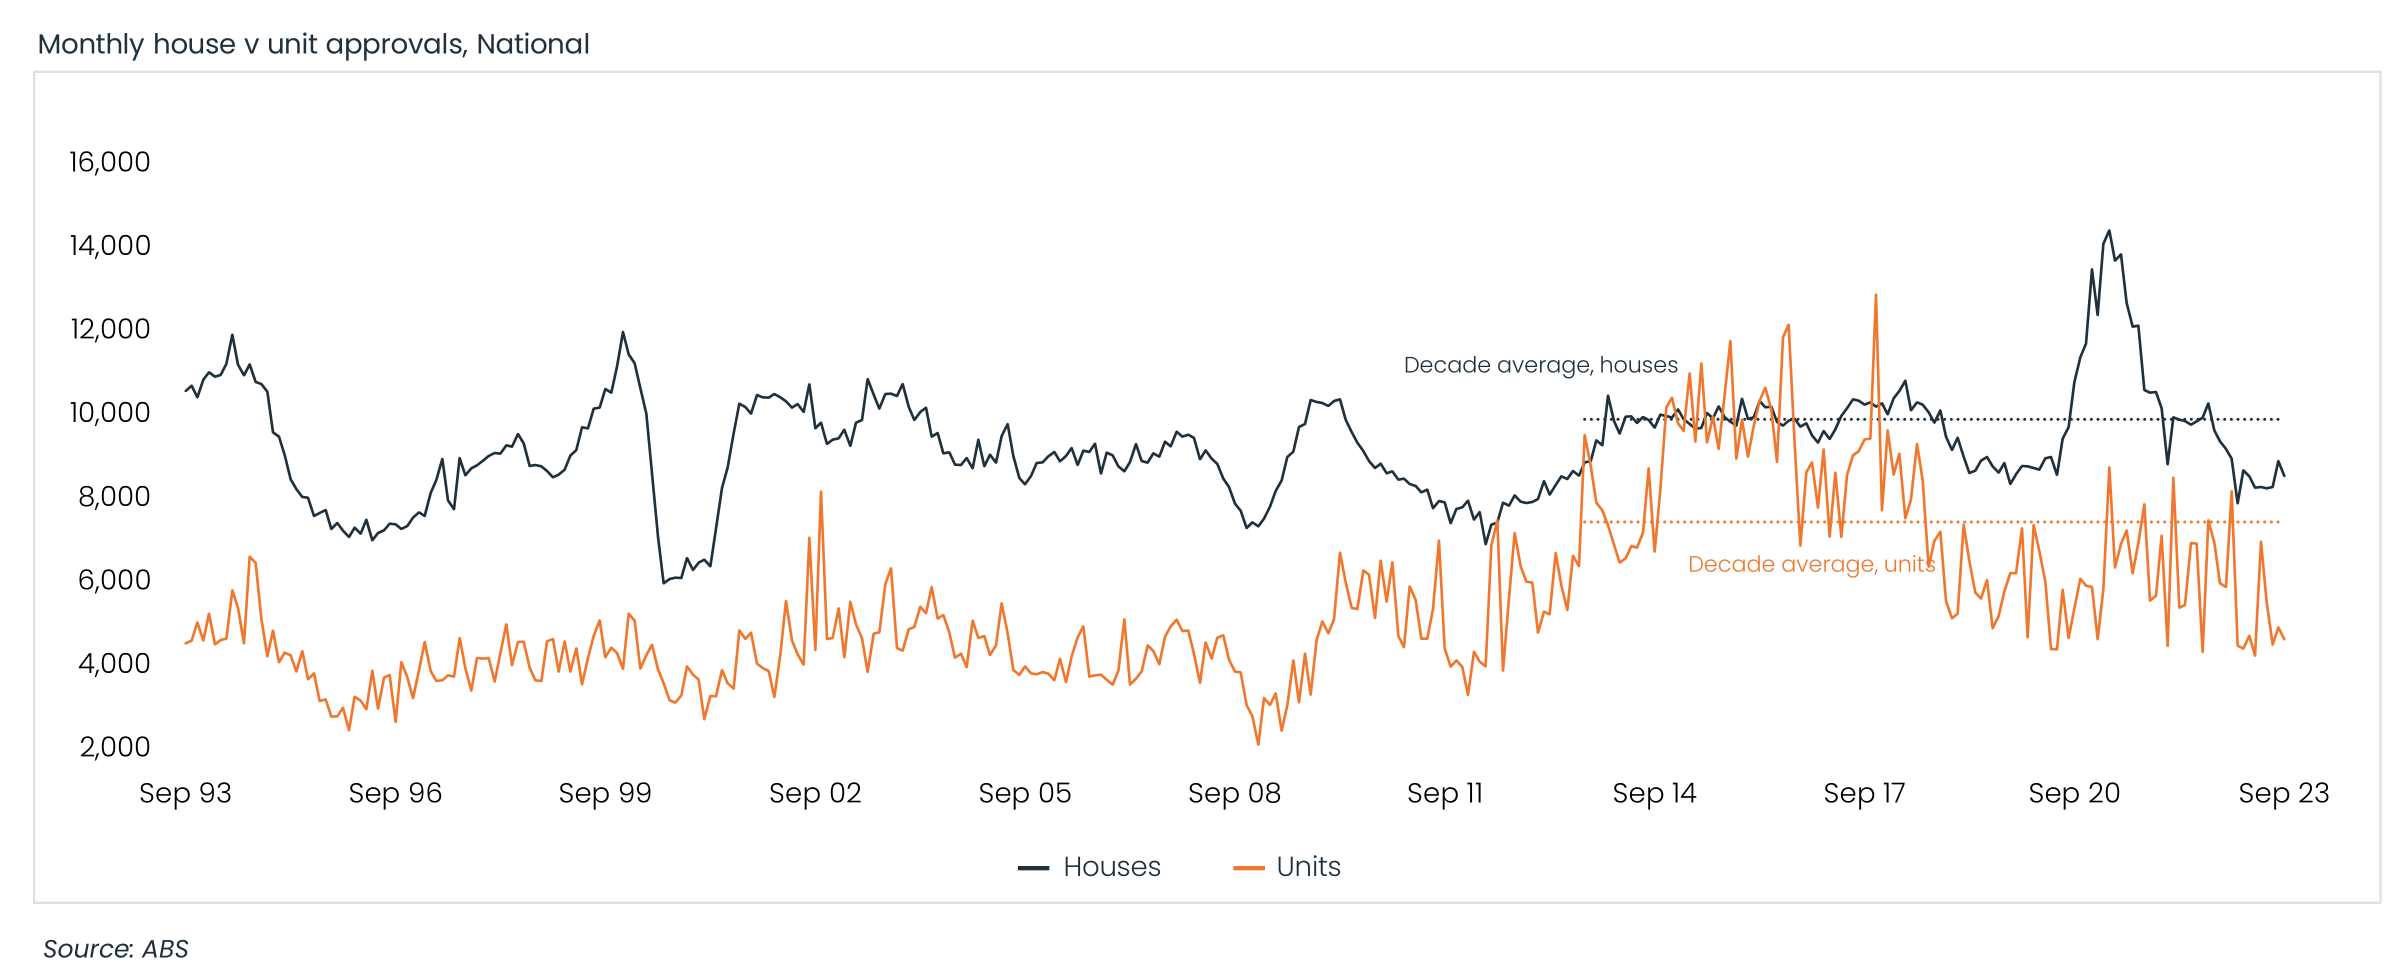
Dwelling approval levels at significantly lower than historic levels
Latest dwelling approvals figures highlight ongoing challenges of the housing market’s ability to keep up with demand. In September, dwelling approvals experienced an additional decline of 4.6%.
- For detached dwellings, approvals decreased by 4.0% in the past month, although they remained higher than the recent low point observed in January.
- Approvals for both houses and units persist in trending significantly below the historically average figures recorded over the past decade,
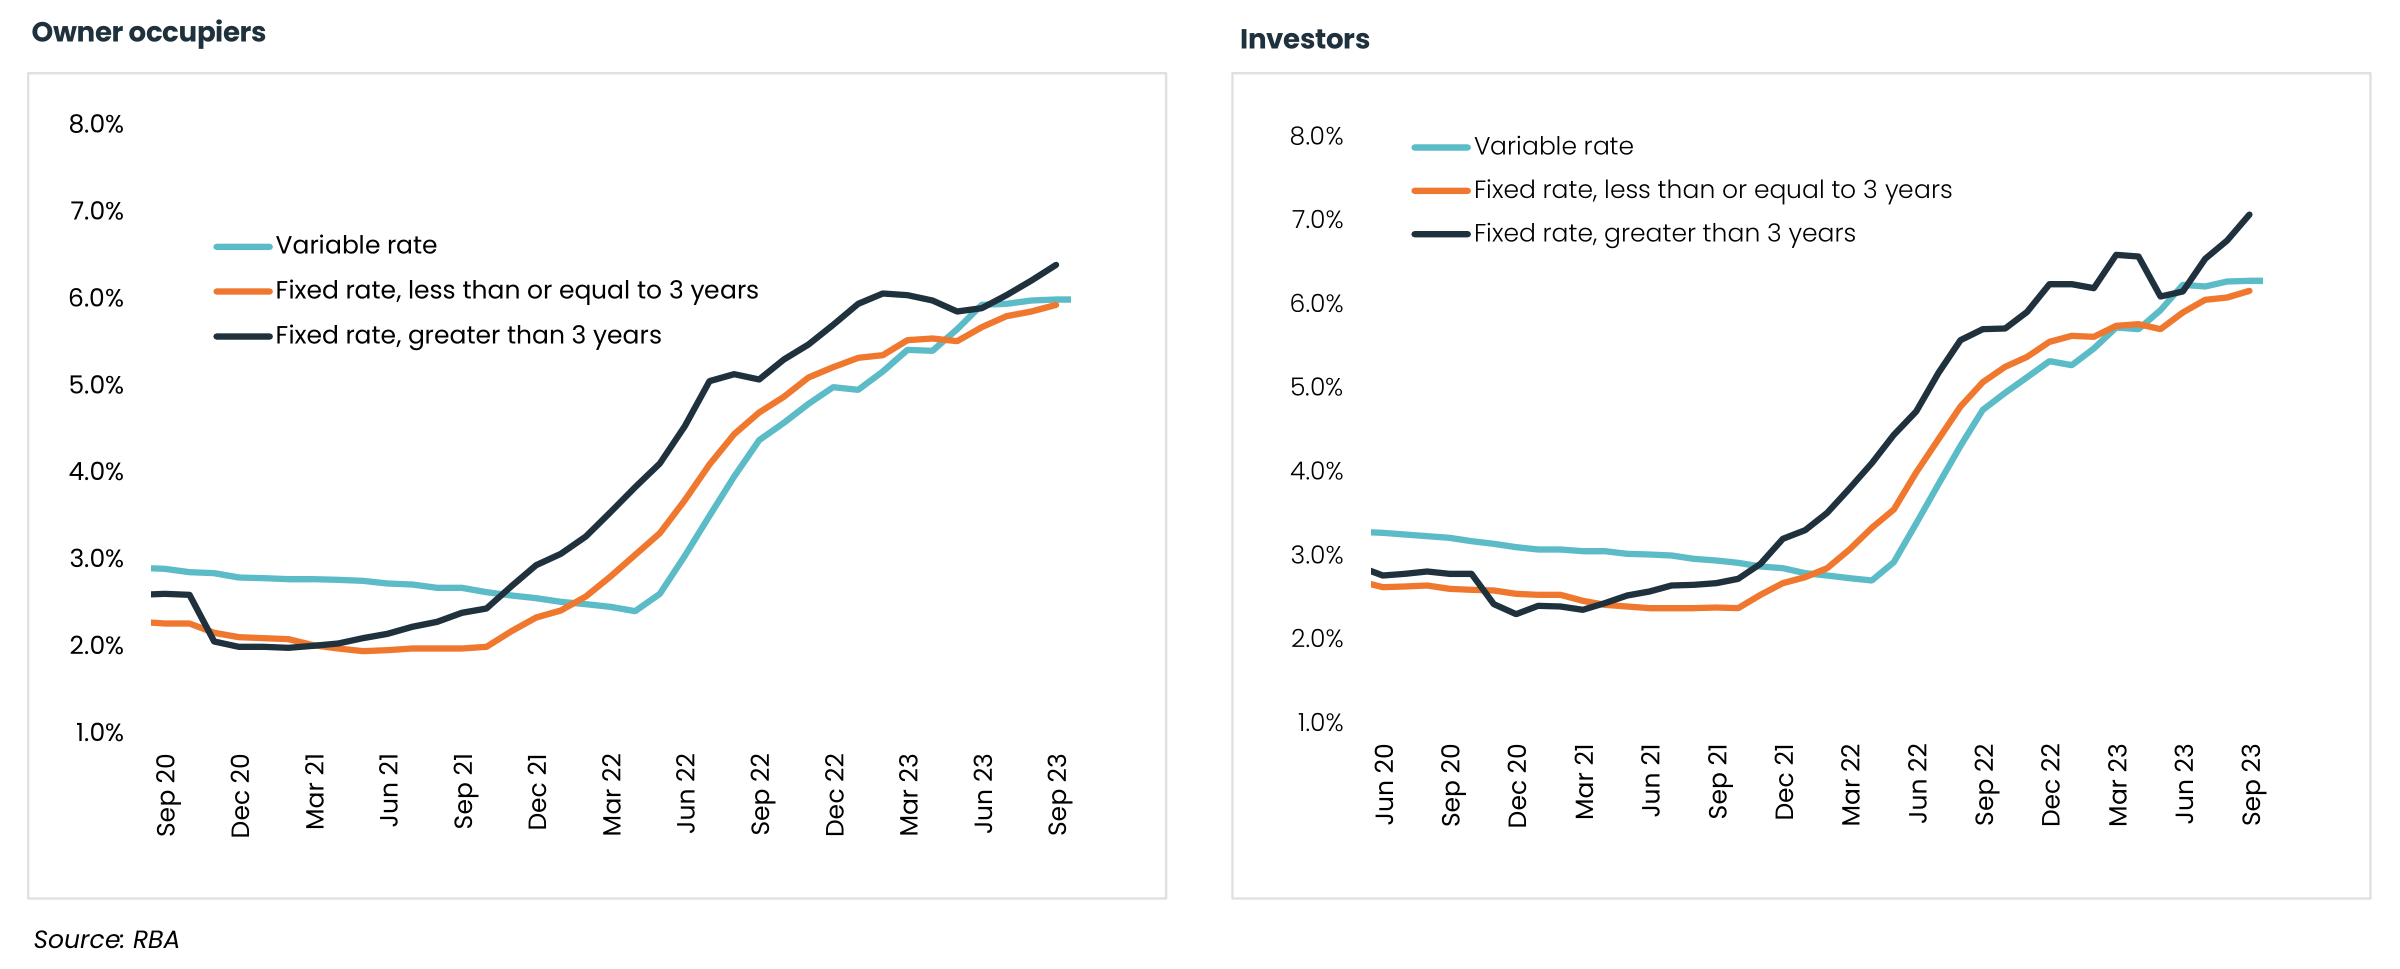
Mortgage rates – where are they at now?
In September new variable rates averaged 6.0% for owner-occupiers and 6.49% for investors. What’s particularly intriguing is that average new fixed rates, especially those with a fixed term exceeding 3 years, are now notably higher than the average variable rates for both types of borrowers. This may suggest that lenders are pricing in expectations of future interest rate increases, prompting them to offer fixed rates at a premium.
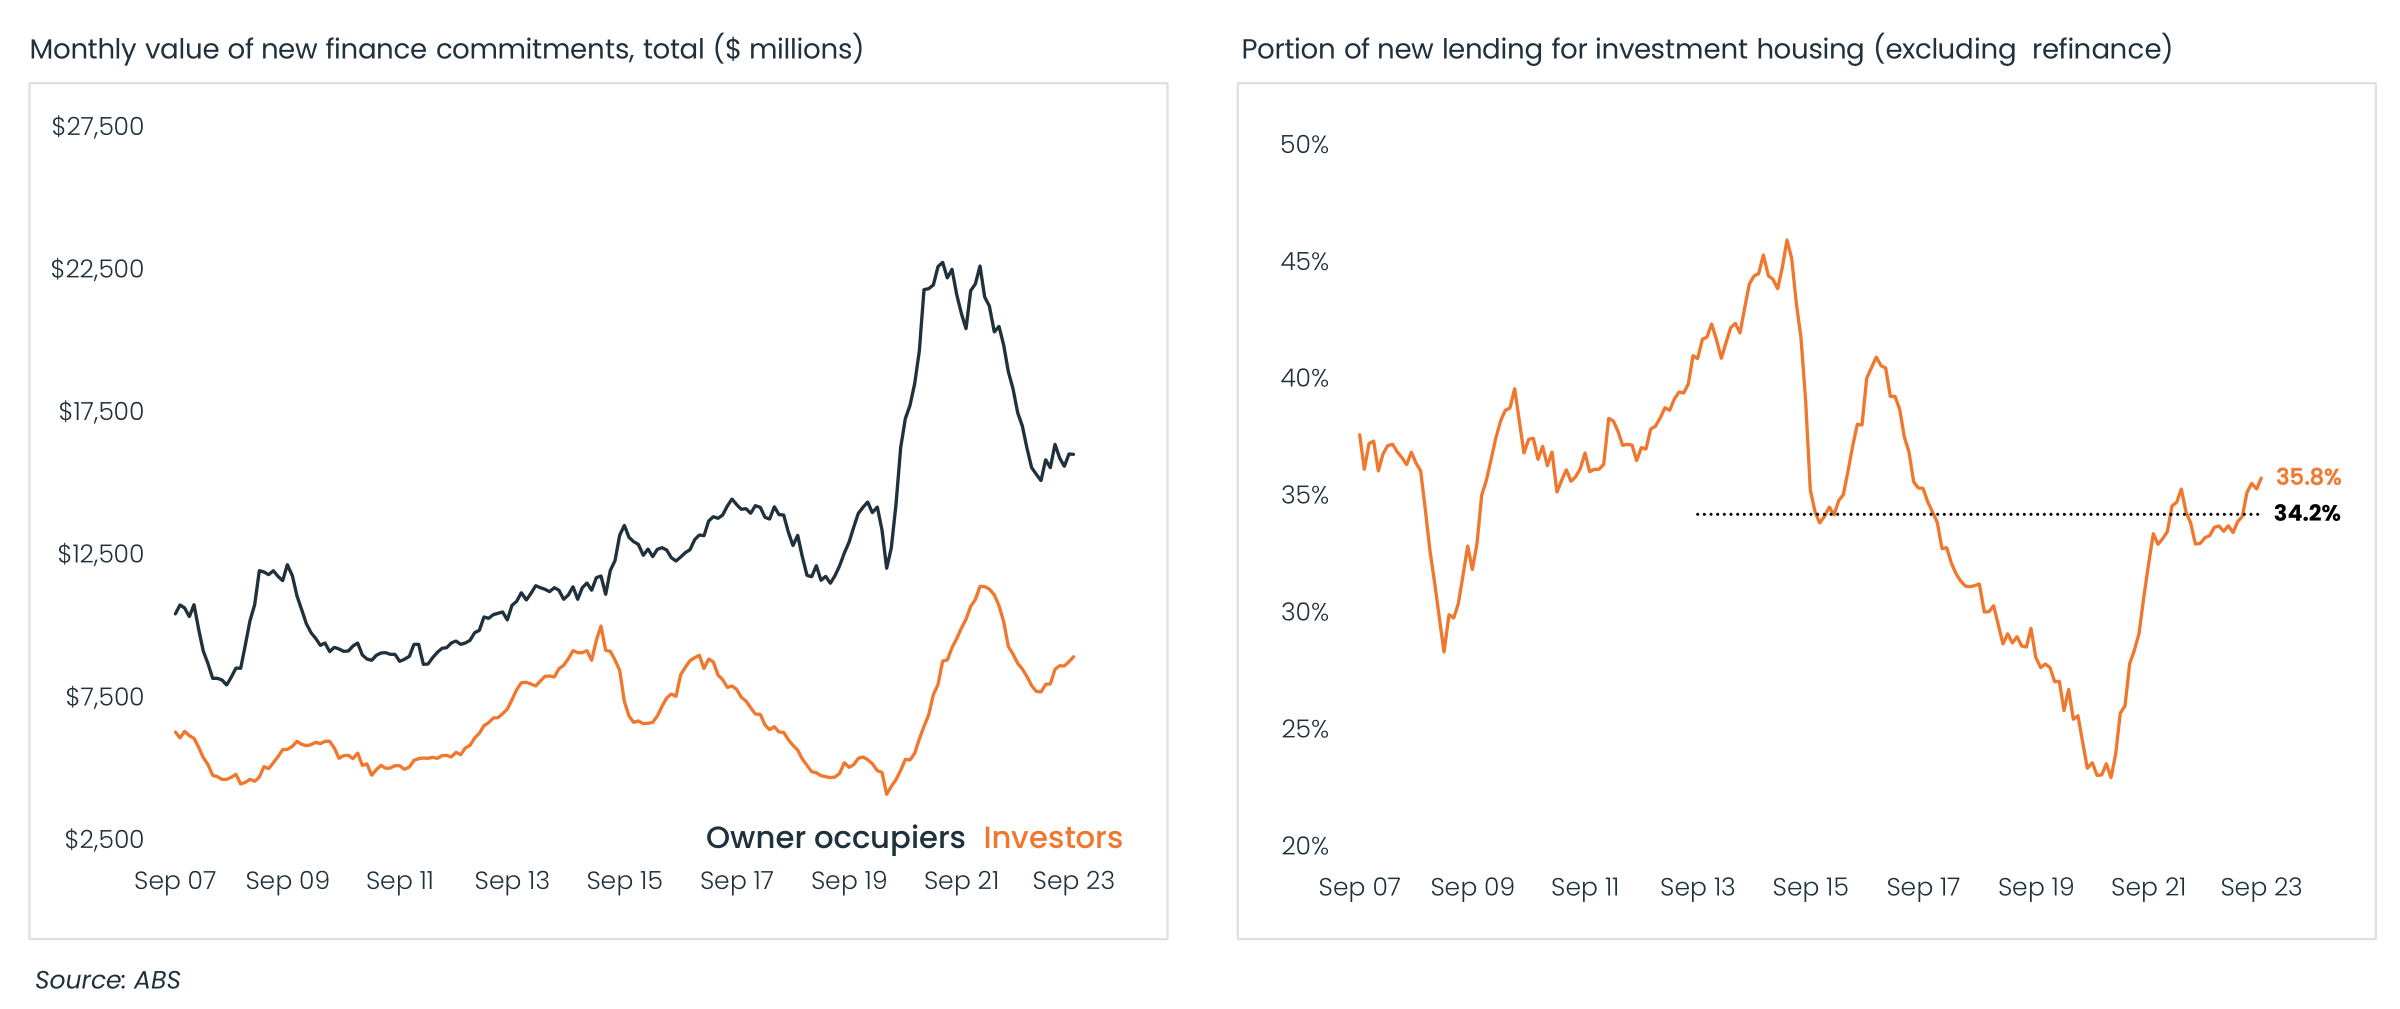
Housing finance levels signal growth in the market
Recognised as a “leading indicator,” housing finance offers a glimpse into the future of our property markets. With increased loan approvals, the trajectory indicates heightened interest and confidence among investors in property investment opportunities. In September, there was a 0.6% increase in the value of new housing finance secured, following a substantial 2.4% rise in August.
This upward trend has propelled new housing lending up by 9.5% since hitting a recent low in February 2023.
Notably, since February, secured housing finance for investors has seen remarkable growth at 16.0%, outpacing the growth in owner-occupier lending, which stood at 6.1%.
Exploring property investment?
Property investment offers numerous advantages, such as tax reduction, debt reduction, wealth generation and retirement planning.
Wealth Street’s proficient team is here to help you navigate the complexities of property investment, offering expert guidance, extensive knowledge, and invaluable education for a prosperous investment voyage. Let us help you today.


Get Started
Every success story starts with a leap of faith. Start a conversation with us.