
Australian real estate surpasses $10 trillion: CoreLogic October housing chart update
16 October 2023


Abdullah Popal
Managing Director
The October Monthly Housing Chart Pack by CoreLogic offers a comprehensive review of the progress in the Australian housing market up until September 2023.
Let’s break down the key highlights in the latest data:
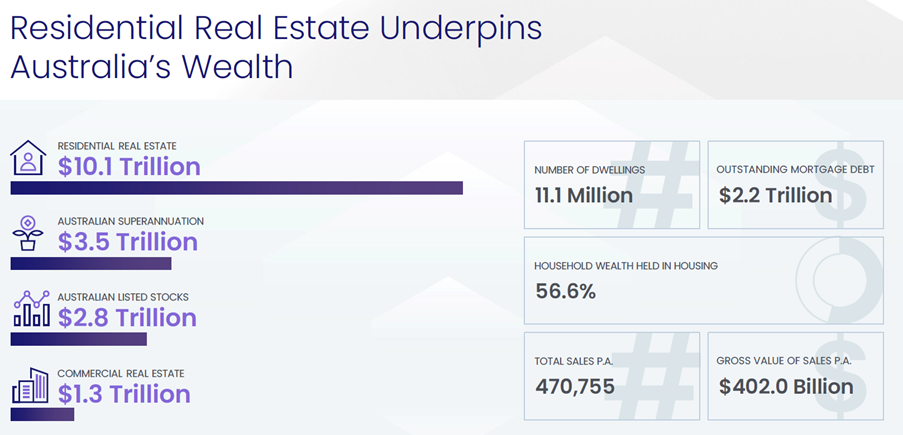
- Australian residential real estate’s total value surpassed $10 trillion in September, showing a continuation of the housing recovery.
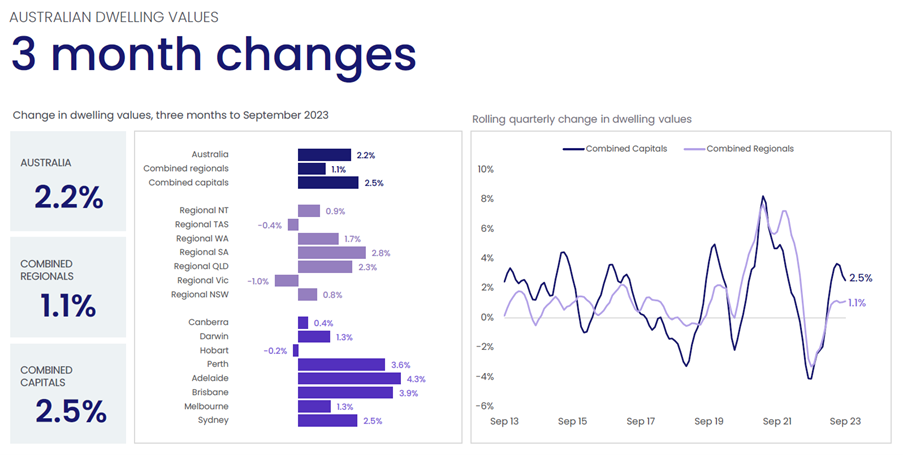
- National home values rose by 2.2% in the three months leading to September, a slight decrease from the previous three months which experienced 2.4% growth.
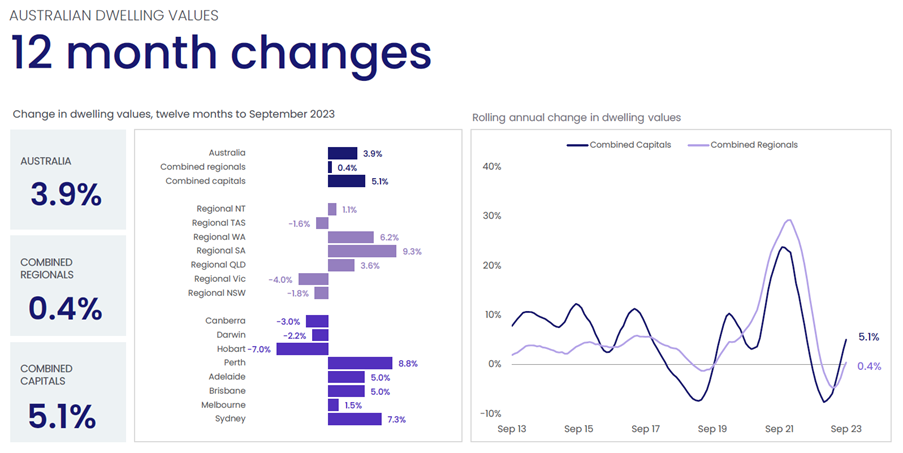
- The Home Value Index shows national dwelling values increased 3.9% in the year to September.
- Capital cities’ dwelling market values went up by 0.9% in September, versus 0.8% in August.
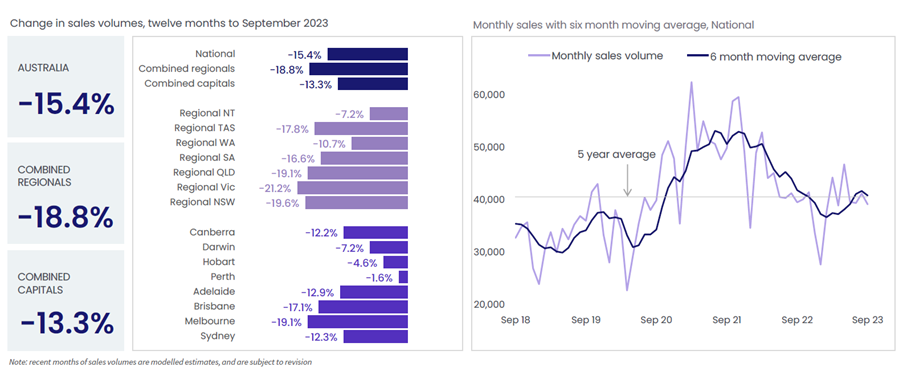
- Approximately 39,216 property sales occurred nationwide in September, slightly lower than the five-year monthly average of 40,607 per month.
- The median time to sell a property remained around 30 days nationally.
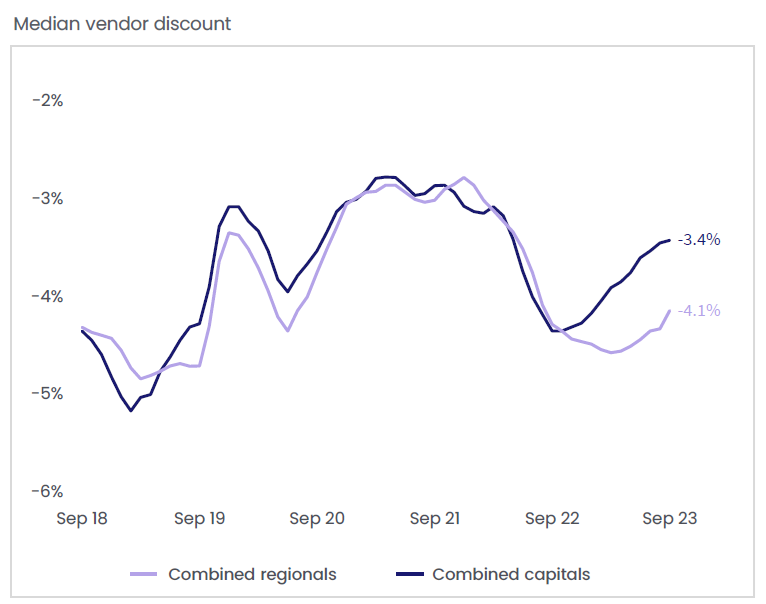
- Vendors offered a smaller discount, with a national median discount of -3.8% over the three months to September.
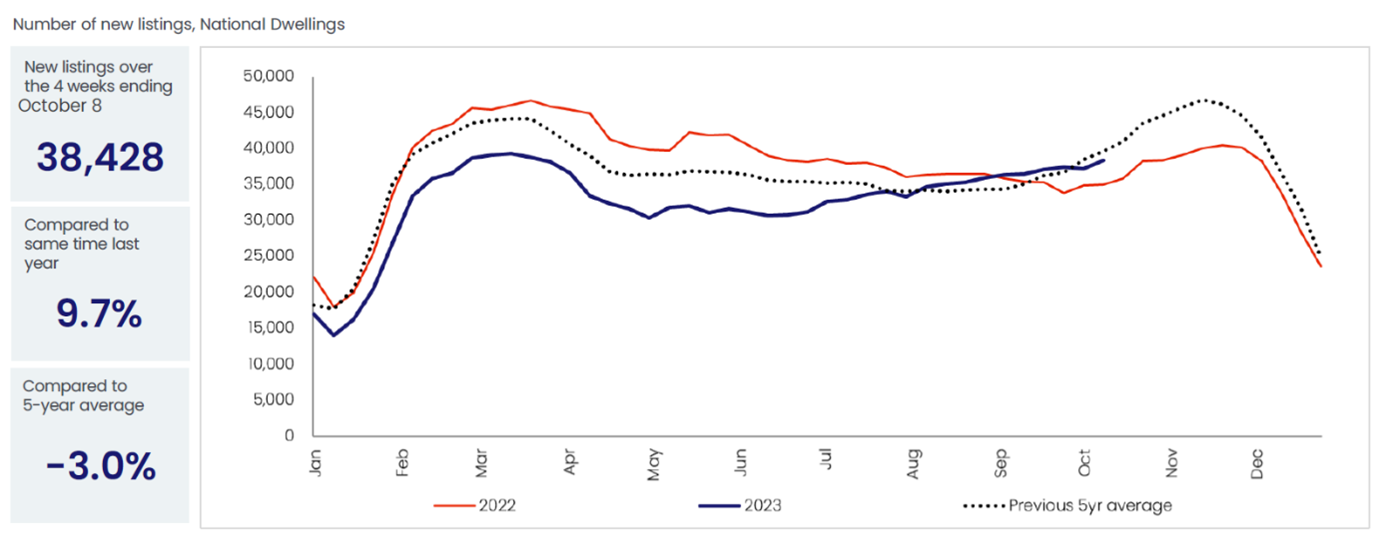
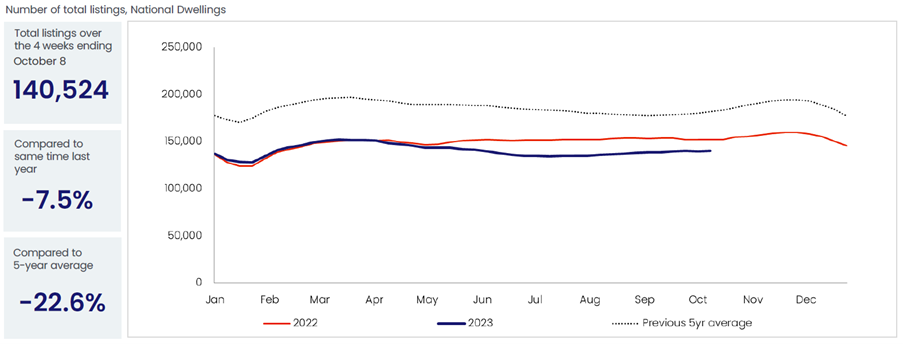
- Nationally, there were 38,428 new property listings with only a -3.0% deviation from the five-year average. Total listings are still below the previous five-year average due to sales but are on the rise in certain markets.
- Rent values in Australia rose by 0.7% in September, with an annual increase of 8.4%, exceeding the previous decade’s average.
- Dwelling approvals jumped by 7.0% in August, led by unit and detached house approvals.
- Construction costs have normalised, as indicated by the Cordell Construction Cost Index, which rose by 0.5% in the September 2023 quarter.
Australia’s housing market – now worth $10.1 trillion
Australian residential real estate’s total value surpassed $10 trillion in September, showing a slight increase from the previous month to $10.1 trillion. Last month’s report highlighted three key factors that attribute to this impressive achievement.
- Increased overseas migration which in turn are boosting housing demand.
- Less borrowings and more savings which is contributing to financial stability.
- High demand and limited housing supply which are continuing to drive property values upward.
As a result, Australia’s combined dwelling market value in major cities experienced a 0.9% increase in September, exceeding the 0.8% growth observed in August. National home values have risen by 2.2% in the three months leading to September, slightly lower than the 2.4% growth in the previous three months. Over the year to September, the Home Value Index reported a 3.9% increase in national dwelling values.
When examining changes over the past 12 months, the overall Australian dwelling value growth averages at 3.9% (5.1% for combined capitals and 0.4% for combined regionals).
CoreLogic’s national Home Value Index (HVI) reported an 0.8% increase, marking the eighth consecutive month of growth. This follows a 0.7% rise in August (revised from 0.8%), resulting in a 2.2% quarterly growth in national home values.
During the September quarter, Adelaide led with the highest capital gain at 4.3%, followed by Brisbane at 3.9% and Perth at 3.6%. Conversely, Hobart experienced a -0.2% decline over the quarter, bringing the southern capital to a new cyclical low.
Understanding supply dynamics is crucial
The performance of each city’s real estate market is heavily influenced by the underlying dynamics of supply.
CoreLogic’s research director, Tim Lawless, emphasises that the performance of each city’s real estate market is heavily influenced by the underlying dynamics of supply. The three cities with the highest capital gains have supply levels in advertisements that are roughly 40% below their five-year averages. On the other hand, Hobart, where property values continue to fall, has kept supply levels above average since June of the previous year, nearly 40% above its five-year average.
Despite the national index bouncing back by 6.6% since hitting a low in January, home values remain 1.3% below the peak noted in April of the previous year. Lawless forecasts that, given the current growth rate, the national HVI is likely to hit a new nominal high by the end of November.
Dwelling values in Perth and Adelaide have already hit unprecedented levels. Brisbane is poised to set a new record in October, with housing values currently just 0.6% shy of their previous peak. Hobart and Canberra still have a significant journey ahead before they can achieve a nominal recovery, with dwelling values still 12.4% and 7.0% lower than their cyclical peaks from the previous year.”
The projected volume of home sales across the combined capital cities has seen a 1.9% increase compared to last year and is 6.3% higher than the five-year average.”
Most regional markets are also experiencing relatively low levels of advertised supply, which has been sufficient to exert some upward pressure on values.
Competition intensifies with shorter median days on the market
CoreLogic’s latest data reveals a national sales figure of 39,216 for September, a tad below the five-year monthly average of 40,607.
Capital city sales amounted to 24,996, marking a 1.8% dip compared to the historic average. In the combined regional market, 14,220 sales occurred, registering a noteworthy 6.1% decrease from the five-year average. This trend suggests increasing competition in the real estate landscape.
As we ramp up selling season, the median days on market are reducing.
The median amount of time it took to sell property in the September quarter was 30 days nationally, and has hovered around 30 days since the April rolling quarter. Notably, regional Australia has seen a greater lift in time on market year-on-year, aligning with other indicators of a softer market performance in these regions in the past 12 months.
For property investors, shorter median days on the market means faster turnover and signals more favorable market conditions for those looking to buy and sell properties.
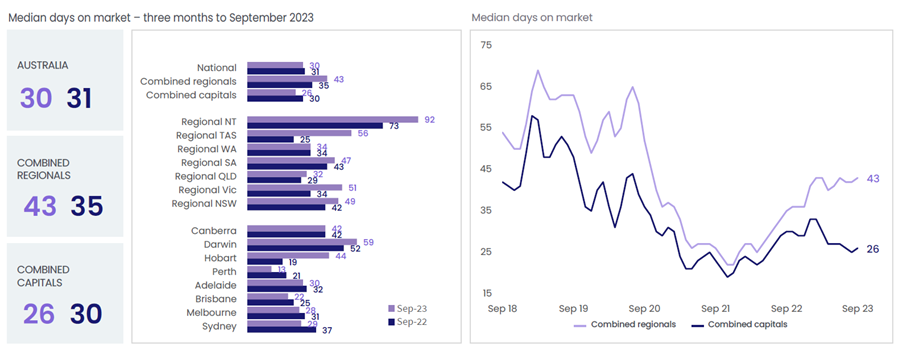
There is also a surge in competitiveness among sellers who are offering smaller discounts on their properties. The median vendor discount nationally decreased to -3.8% in the three months to September, indicating that sellers are keen to maximize their capital gains. This trend is especially promising for investors as it implies the potential for better returns on their investments.
Also, fewer discounts are being offered because there are more new listings, especially during the spring selling season. Approximately 38,428 new listings were observed at the national level over the four weeks leading to October 8, 2023. These new listings are only -3.0% lower than the historic five-year average. This surge in new listings indicates increased market activity, which can benefit investors by providing more options to choose from.
While total listings in Australia are still trending lower than the previous five-year average due to absorption from sales at a national level, some markets are seeing a rise in total listings. This is particularly evident in Melbourne, Hobart, Canberra, and select regional markets. For investors, this diversification in the property market can offer a range of opportunities in different regions.
Supply levels are also a noteworthy aspect. Across major capitals, supply levels are -15.5% lower than a year ago and nearly -19% below the previous five-year average. This situation provides investors with a favorable scenario where demand potentially outpaces supply, potentially leading to price appreciation.
Notably, Perth, Adelaide, and Brisbane stand out with low supply levels – more than -40% below the previous five-year average. For investors, this translates to potential growth opportunities in these cities, where demand is strong and supply is limited.
“The current market conditions, marked by reduced discounts, an increase in new listings, and varying supply levels across different cities, offer potential property investors a range of opportunities to explore and leverage for financial gain”
At the national level, there were 38,428 new listings observed over the four weeks to October 8, 2023. New listings are trending higher into the start of the spring selling season, and are just -3.0% lower than the historic five-year average.
New listings are declining as homeowners are retaining their properties to experience benefits of the upwards pressure on housing values.
On a national scale, there were a total of 140,524 property listings within the four weeks leading up to October 8, 2023. While these numbers still remain below the previous five-year average due to robust sales activity, it’s worth noting that in specific markets, total property listings are on the rise. This trend implies that despite the overall market absorption, certain areas are showing increased opportunities for investment and portfolio expansion. It’s a signal to keep a keen eye on these markets as they might provide advantageous conditions for property acquisition and diversification.
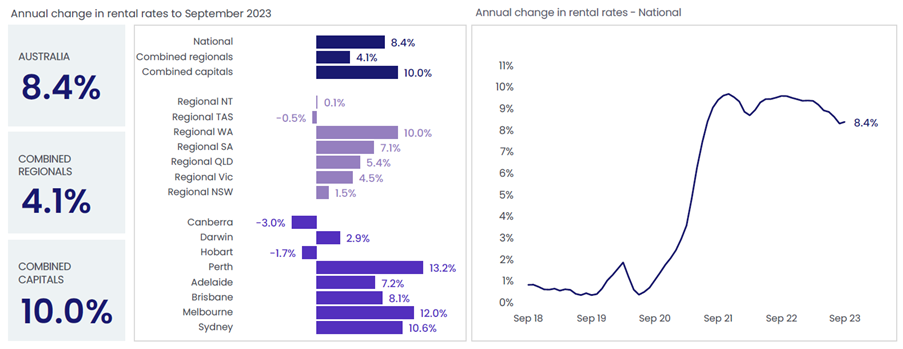
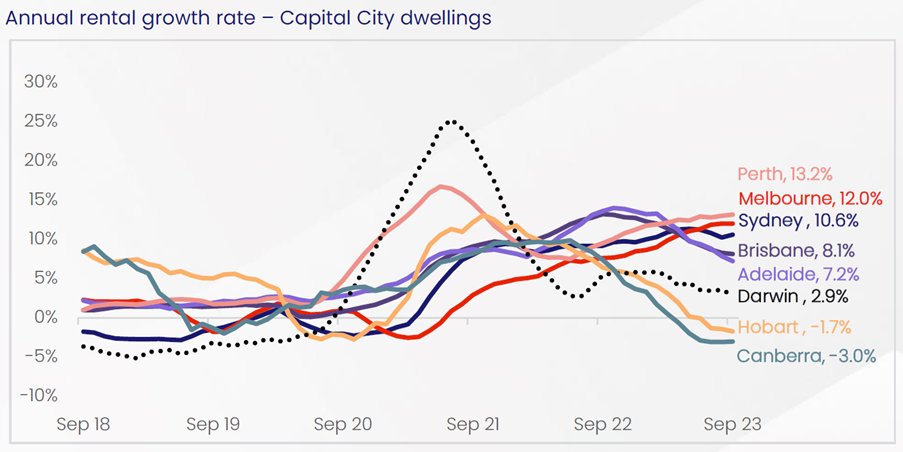
Australian Rental Market Soars: 8.4% Annual Increase Breaks Decade Average
Rental values in Australia increased by 0.7% in September, with an annual increase of 8.4%, exceeding the previous decade’s average. Increased migration is pushing rental rates higher, particularly in cities like Perth, Melbourne, and Sydney.
CoreLogic’s Q3 Quarterly Rental Review highlights several trends in the rental market. During the September quarter, national rent values saw a 1.6% increase, although this was slightly lower than the 2.2% rise in the previous June quarter. The ongoing scarcity of rental listings has been a key driver of rising rents, with the national vacancy rate hitting a record low at 1.1%, resulting in a shortage of approximately -47,500 listings by early October.
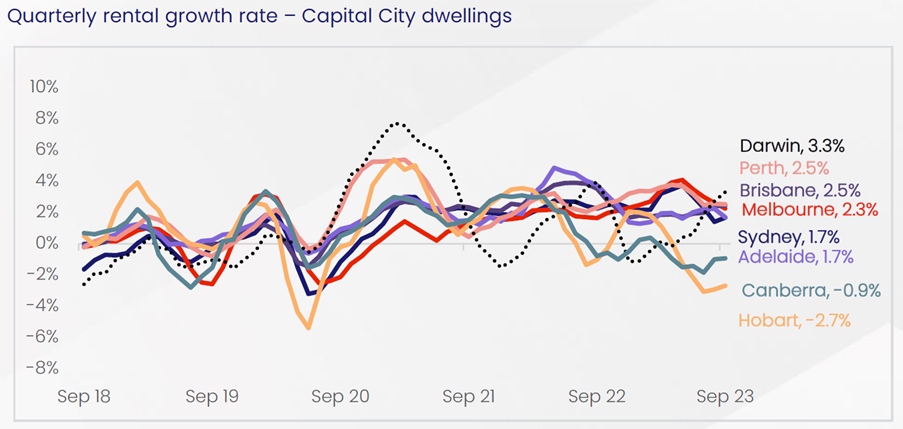
Notably, house rents are rising faster than unit rents, showing a 1.7% increase compared to a 1.3% rise in unit rents over the three months to September.
National gross rental yields experienced a slight decline in August but rebounded to 3.71% in September. Brisbane recorded the most robust quarterly increase in unit rents at 3.0%, while Darwin led with a 3.7% rise in house rents.
However, Hobart and Canberra were the only capitals that witnessed quarterly rental declines in both house and unit rents. Sydney remains the country’s most expensive rental capital, with median dwelling rents at $726 per week, while Adelaide lost its title as the cheapest rental capital to Hobart, which had a median rental dwelling value of $529 per week and a median house rent of $541 per week. Hobart and Adelaide shared the lowest median unit rental value among the capitals at $436 per week, suggesting diverse opportunities for investors to explore in the rental market.
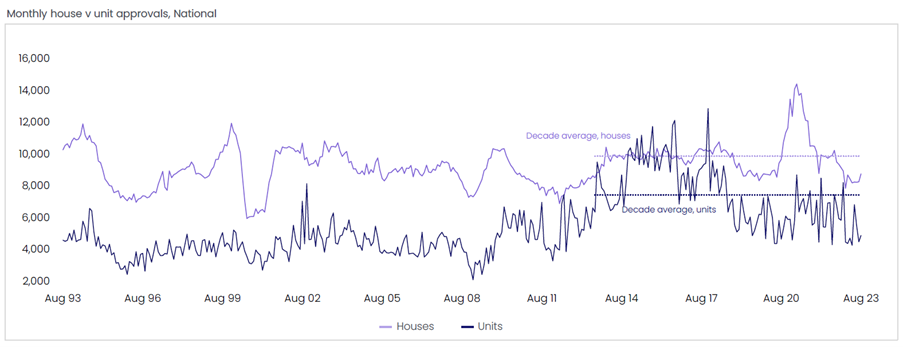
7% growth in dwelling approvals amid ongoing challenges
Dwelling approvals jumped 7.0% in August, driven by a 8.8% lift in unit approvals and a 6.0% lift in detached house approvals. Overall, new dwelling approvals have been tracking around -21% below the decade average since the start of the year, with high interest rates, land values and construction costs contributing to subdued development application levels.
There has been a significant development in dwelling approvals, with a notable 7.0% increase observed in August. This surge was primarily fueled by an impressive 8.8% rise in unit approvals and a solid 6.0% increase in detached house approvals.
However, it’s crucial to acknowledge that, despite this surge, new dwelling approvals have been consistently tracking around -21% below the decade average since the beginning of the year.
Factors such as high interest rates, elevated land values, and increased construction costs have played a role in keeping development applications at more subdued levels.
Owner-Occupier Housing Finance Drives 2.2% August Surge, Investor Finance Modest
The value of home lending has seen a 2.2% increase during August with owner occupier housing finance leading the charge, rising by 2.6%.
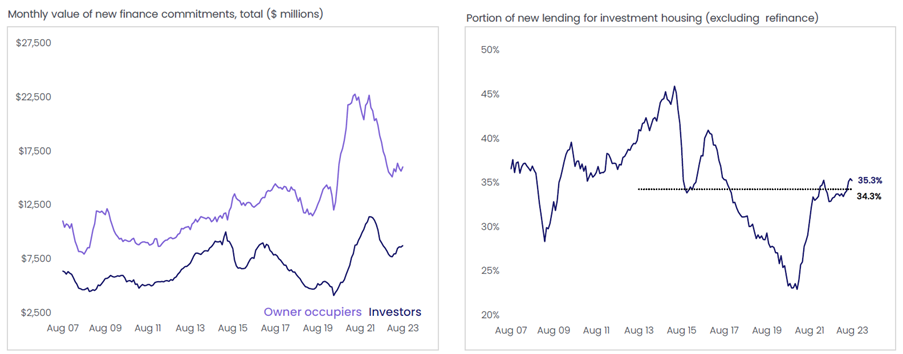
Meanwhile, investor finance showed a more modest 1.6% increase.
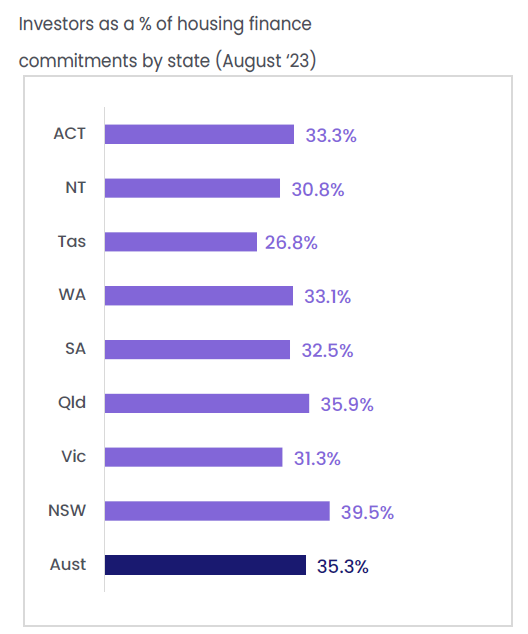
In the past five months, there has been a decline in monthly new home lending, marking a significant 9.4% year-on-year drop. Nationally, investor finance constituted 35.3% of new mortgage lending in August, with the highest share of investment lending observed in New South Wales at 39.5%, closely followed by Queensland at 35.9%
This data indicates a fluctuating lending landscape and potential shifts in the property investment landscape, prompting investors to stay vigilant and adapt to changing market conditions.
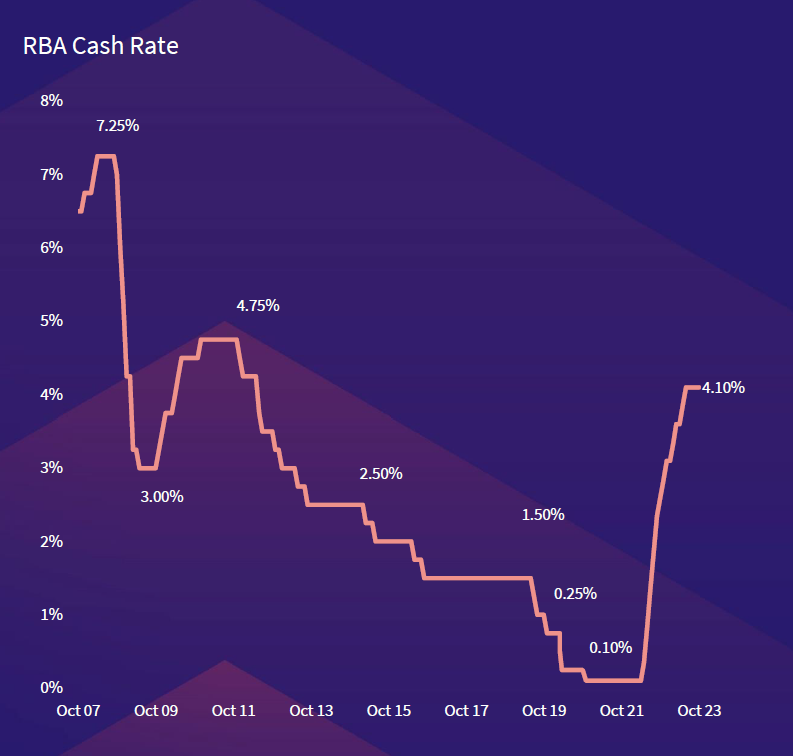
RBA keeps interest rates stead by warns of potential tightening
The Reserve Bank of Australia (RBA) has maintained a steady cash rate at 4.1% for the fourth consecutive month. Inflation however remains at elevated levels, with increasing costs in services, rising fuel prices, and high rents exerting pressure. The RBA has also indicated the possibility of further tightening of monetary policy to ensure that inflation returns to the target range within a reasonable timeframe, but this would be contingent on the evolving assessment of risks and data.
This information underscores the importance of staying informed about potential future interest rate changes, which can impact borrowing costs and, subsequently, property investment and purchasing decisions.
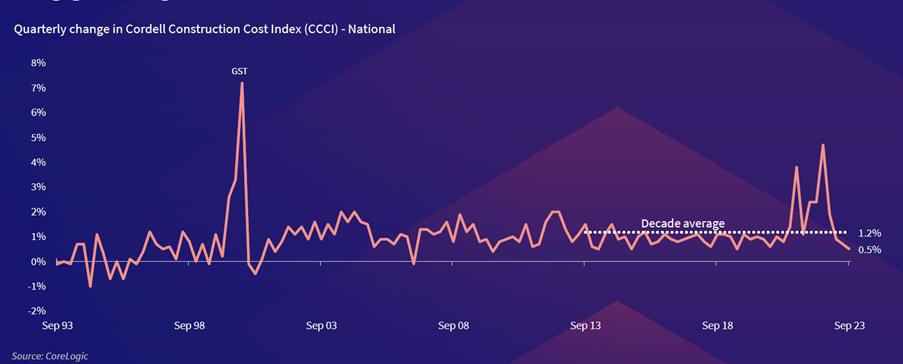
Construction costs growth slows, favouring property developers and investors
The latest data featuring the Cordell Construction Cost Index (CCCI) indicates that while construction costs remain relatively high, the growth in construction costs have started to normalise.
The CCCI monitors the expenses involved in constructing a typical new dwelling, revealed a quarterly growth rate of 0.5% in the September quarter. This marks the smallest increase since the three months leading up to June 2019 and is just half of the pre-COVID decade average of 1.0% per quarter. It also marks the fourth consecutive slowdown in the quarterly pace of growth for residential construction costs.
Summary:
Amidst these dynamic market conditions, investors are presented with a plethora of opportunities for financial gain, as sellers reduce their discounts, and the number of property listings ebbs and flows while rental growth patterns vary across diverse property types and cities.
As the Reserve Bank holds the cash rate steady, the prospect of future monetary policy adjustments looms, contingent upon the evolving economic data and inflationary pressures.
The robust rental market, boasting an 8.4% annual increase in rental values, presents a steady income stream for property owners.
The current supply and demand dynamics, particularly in cities like Perth, Adelaide, and Brisbane, with supply levels significantly below the five-year average, create an environment where demand is poised to outpace supply, potentially leading to substantial price appreciation.
As construction costs stabilise and new listings decline due to homeowners choosing to hold onto their properties, investing in new property developments rather than existing ones becomes an increasingly attractive option. The current market conditions indicate that the reduced supply of new listings is likely to continue, making new builds a valuable commodity.
For a deeper dive into the latest October National Housing Market Update, check out the insightful video presented by Tim Lawless.
Investing in real estate is a multifaceted endeavor, especially in today’s dynamic market. If you find yourself unsure about your next steps, it’s time to connect with Wealth Street.
We specialise in empowering everyday Australians to make well-informed investment choices, setting them on the path to financial prosperity. Start your conversation with us today and embark on your journey toward financial success


Get Started
Every success story starts with a leap of faith. Start a conversation with us.